


")


Introduction
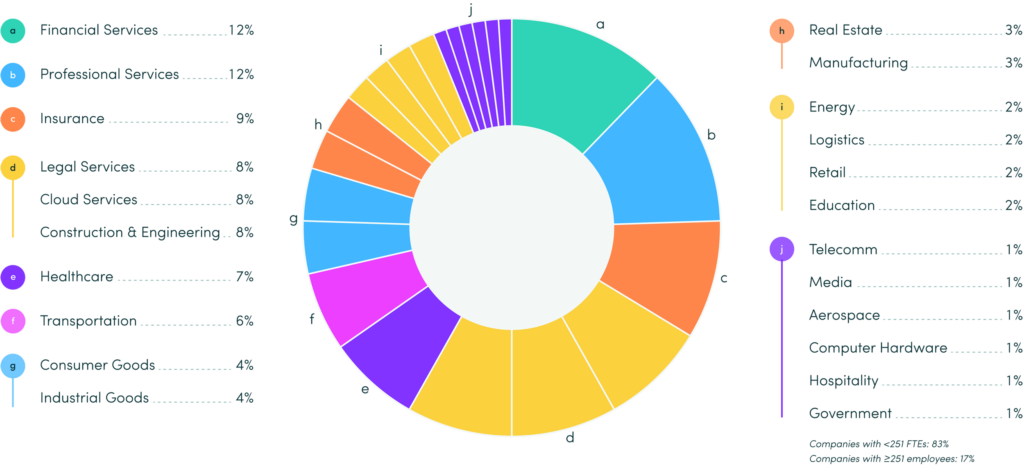
The ActivTrak Productivity Lab is committed to challenging workplace assumptions and elevating today’s workplace realities and discourse. This year, our State of the Workplace report provides a deep-dive examination of workplace behaviors spanning three years of customer data, including 218,900 employees across 777 companies — representing one of the most comprehensive and objective studies of productivity behaviors to-date.
The study examines productivity, engagement, work location and AI adoption to reveal current workplace dynamics and help organizations better plan for the future.
Notably, we found workdays have become more concentrated, with employees compressing productivity into shorter timeframes. Employee well-being also shows encouraging trends, with 70% of employees maintaining healthy work patterns — the highest level in three years.
The workplace has also seen dramatic growth in AI adoption, with 58% of employees now using AI tools in some capacity — up 107% from 2022. This technological shift, combined with evolving location preferences, is reshaping traditional work patterns and challenging organizations to adapt strategies for employee productivity and engagement.
Executive Summary
- Employees are more efficient and productive: The average workday is 36 mins (7%) shorter but 2% more productive
- Collaboration and multitasking chip away at focus: Focus efficiency decreases to 62% while focus time drops by 8%
- Healthier organizations are on the rise: 70% of employees maintain healthy work patterns — the highest level in 3 years
- Weekend work continues: 5% of employees work on weekends, up 9% since 2023, with patterns varying by business size
- Remote is common: The majority of employees (53%) spend more than 60% of the year working in a remote environment
- Remote yields better productivity: Remote-only workers have the highest daily productivity (+29 mins) vs. other worker types
- AI adoption sees upward trend: 58% of employees now use AI tools — a 107% increase
- AI usage doesn’t lead to shorter work days: AI users show consistently longer workdays (+8 mins) and lower focus time (-27 mins)
AREA OF STUDY
Productivity
The Lab studied:
- What does an average day of digital work look like? How has it changed over the last three years?
- Do behaviors vary during a typical workweek or throughout the year?
Key Findings:
- Employees are more efficient and productive: The average workday
is 36 mins (7%) shorter but 2% more productive. - Focus efficiency decreases to 62% while focus time drops by 8%.
PRODUCTIVITY
Productivity Trends
- The workday continues to evolve. Most notably, the workday is now 36 mins shorter (-7%) — averaging 8 hrs 44 mins a day. While employees consistently start their workday around 8 a.m., they finish earlier — shifting from 5:21 p.m. two years ago to 4:39 p.m. in 2024.
- This change represents more efficient time utilization rather than decreased productivity, as average productive hours increased 2% (+6 mins to 6 hrs 17 mins), despite the shorter workday. Even more significant, the average productive session increased from 20 to 24 mins, a 20% improvement.
By industry, Logistics leads the way with 7 hrs 3 mins of productive time, followed by Insurance (6 hrs 35 mins) and Financial Services (6 hrs 32 mins). The Aerospace industry has the least productive time at 5 hrs 1 min.
Productive Time by Industry
- The rhythm of work throughout the year also evolved. Unlike previous years where workday length fluctuated by quarter, 2024 showed remarkable consistency, with Tuesdays having the highest productivity levels and Fridays the lowest. Seasonally, 2024 diverged from historical patterns, with workday length peaking in August and December (9 hrs), and dropping to its shortest length in February and October (8 hrs 35 mins).
- Industry analysis reveals notable variations in workday patterns. Logistics employees have the longest average workday at 9 hrs 10 mins while Financial Services maintains the second-longest at 9 hrs 7 mins (+23 mins vs. the overall average). Meanwhile, Media has the shortest workday at 7 hrs 44 mins, a full hour below the overall average.
2024 Workday Metrics


PRODUCTIVITY
Focus & Collaboration Dynamics
- The nature of focused work has undergone subtle but important changes. Focus efficiency (the percentage of focused time relative to total time) decreased from 65% to 62%, and the average focused session shrunk 8%.
- The decline in focused work correlates with significant increases in collaborative and multitasking activities:
- Collaboration time increased 27% (+8 mins)
- Multitasking increased 5% (+4 mins)
- Q2-Q4 2024 had the highest multitasking levels (1 hr 28 mins or more)
Industry analysis shows Healthcare leading in daily focused hours at 4 hrs 47 mins (+36 mins above average), with Insurance and Legal Services also showing strong focus time. Education has the lowest focus time at 3 hrs 29 mins.
Daily Focus Time


- While workdays are shorter and more concentrated, the simultaneous increase in productive time suggests organizations are working smarter.
- As these trends continue, organizations must weigh the advantages of efficiency against maintaining sustainable work practices and employee well-being.
- Coaching is a potential solution to help employees balance focused work with growing demands for collaboration and multitasking.
Resources
Six in 10 employees say they aren’t getting the on-the-job coaching they need to support their core job skills. (Harvard Business Review)
The top productivity barrier across all workforce segments (53% of workers) is interruption. (Deloitte)
AREA OF STUDY
Engagement
The Lab studied:
- How pervasive are disengagement and burnout-related risks across the workforce?
- Have weekend work habits shifted?
Key Findings:
- 70% of employees maintain healthy work patterns — the highest level in three years.
- 5% of employees work on weekends, up 9% since 2023, with patterns varying by business size.
ENGAGEMENT
Engagement Trends
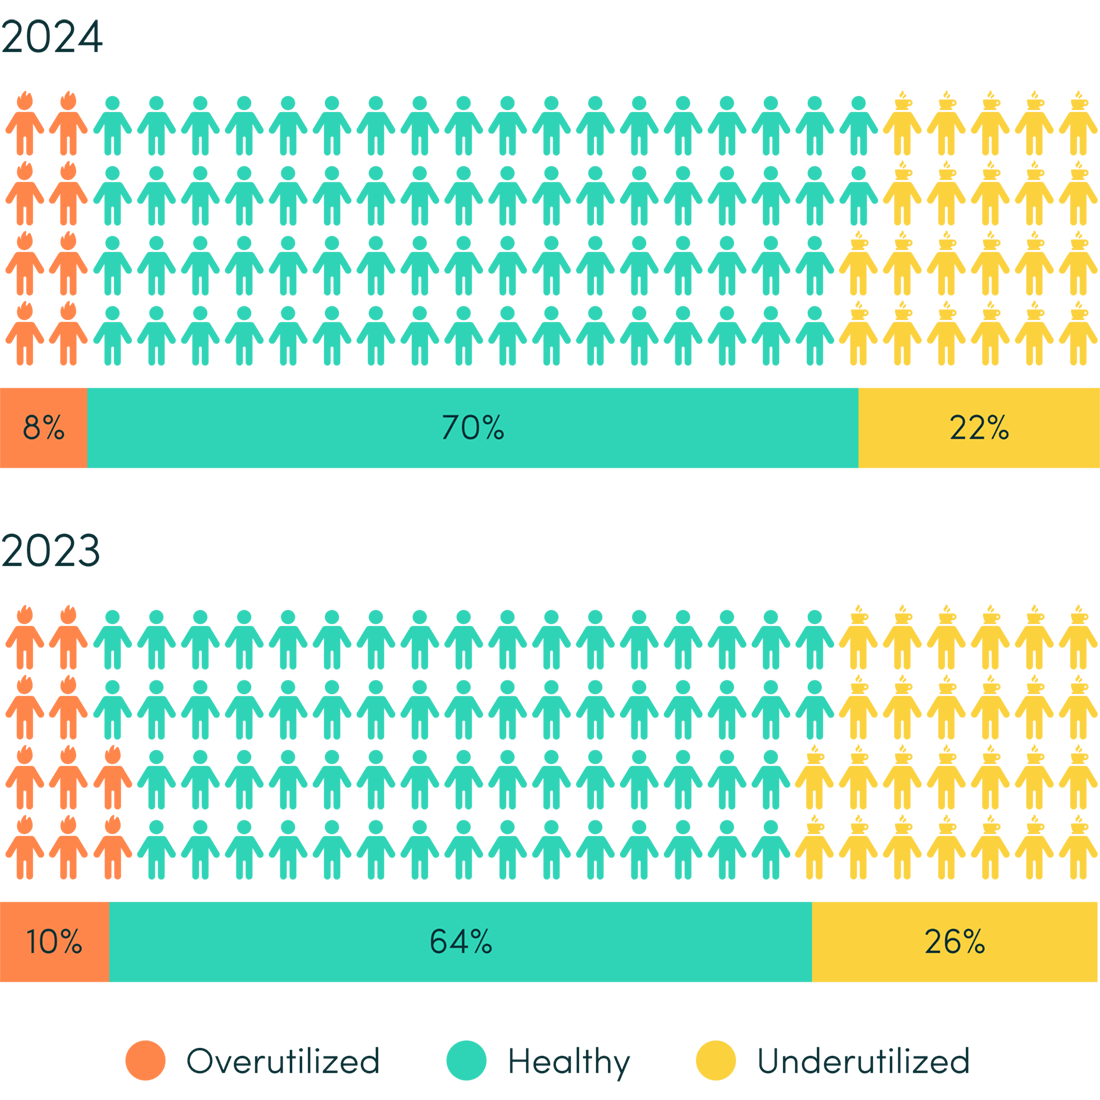
- Employee engagement and utilization show encouraging trends toward better work-life balance, with 70% of employees maintaining healthy work patterns — the highest level in three years.
- Compared to 2023, this includes a 21% drop in overutilized employees, and a 14% drop in underutilized employees.
Industry analysis shows Legal Services leading with 80% healthy employees, followed by Cloud Services (77%) and Insurance (75%). Fourteen sectors fall slightly below the overall average, with Education having the lowest percentage of healthy employees (30%).
Workload Balance

- The most dramatic shift in overutilized employees was in Q4 2024 (-60% vs Q3 2024), suggesting a potential pivot toward more sustainable work patterns. However, some challenges persist, comparing 2024 to 2023:
- Burnout risk: decreased 21%
- Disengagement risk: held steady at 21%
- Weekend work: increased to 11 hrs 55 mins (up from 10 hrs 35 mins)
- Additionally, Fridays saw a consistent decrease in overutilization with a corresponding increase in underutilization over the last three years.
Risk Metrics
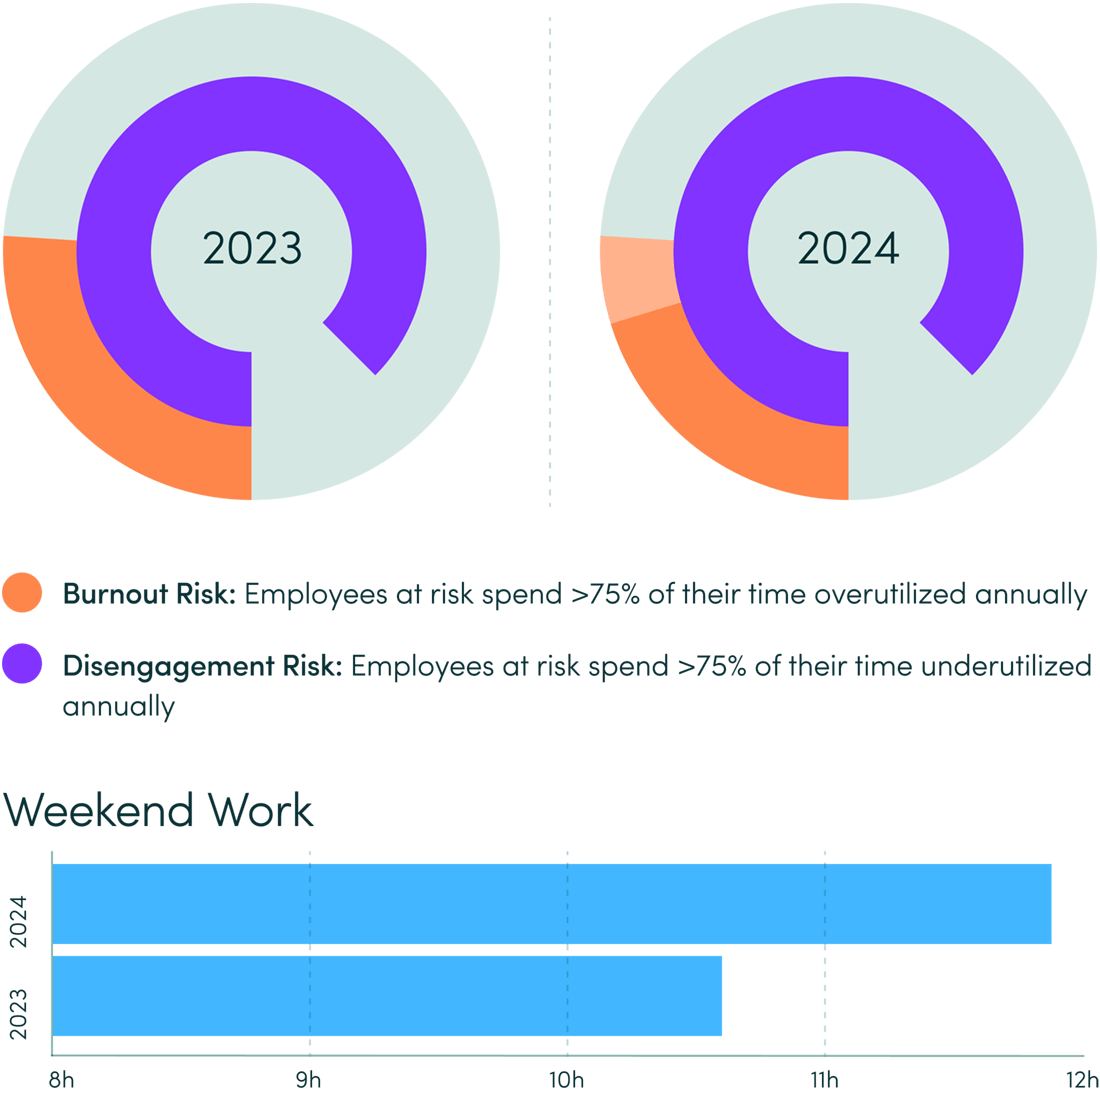
- In 2024, 5% of workers worked one or both weekend days, up 9% over 2023. Employees who worked Saturday and Sunday averaged 6 hrs 30 mins, one hour longer than those who worked only on Saturday (5 hrs 30 mins) or Sunday (5 hrs 24 mins). [Data Set B]
- Weekend work patterns vary notably by business size. Companies with 1,001-5,000 employees show the largest percentage of weekend workers (12%), 2X to 6X larger than any other business size. [Data Set B]
- While organizations have made significant strides to foster healthy work habits and reduce burnout risk, the rise in weekend work — particularly in larger enterprises — suggests the need for ongoing vigilance to protect work-life boundaries.
Resources
Overall employee engagement increased from 66% in 2024 to 71% in 2025. (Qualtrics)
Area of STudy
Work Location
The Lab studied:
- How do employee work habits vary by location?
- How did Return-to-Office initiatives impact employee work habits?
Key Findings:
- The majority of employees (53%) spend more than 60% of the year working in a remote environment.
- Remote-only workers have the highest daily productivity (+29 mins) vs. other worker types.
Work Location
Work Location Trends
- Work location strategies continued to evolve in 2024 with organizations embracing flexibility over traditional office mandates [Data Set C].
- After examining five unique work location types — remote-only, remote-first, hybrid, office-first and office-only — several productivity patterns emerged, including that the majority of employees (53%) spend more than 60% of the year working in a remote environment.
2024 Work Location Distribution

2024 Worker Productivity Patterns
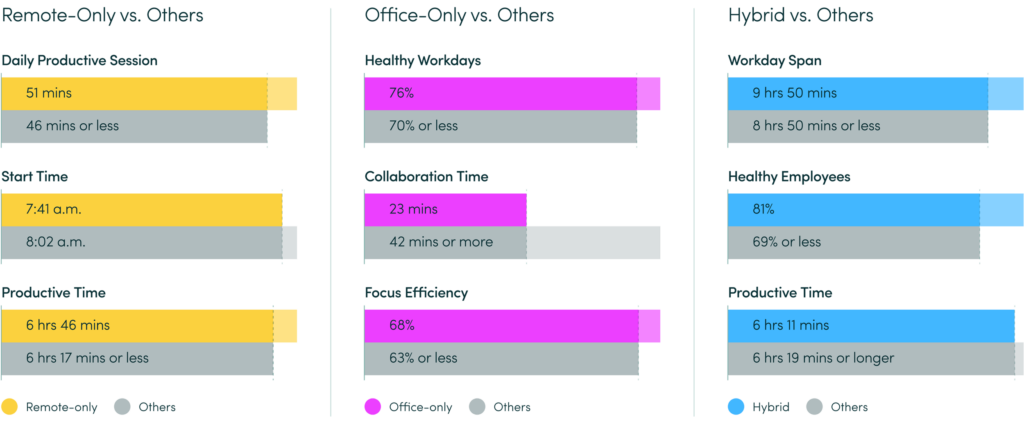

- While all location types have similar percentages of healthy employees, remote-first companies have the highest percentage of overutilized employees (1.5X more vs. other location types). In contrast, office-first companies have a greater percentage of underutilized employees (+4% or more). [Data Set C]
- Interesting paradoxes also emerge. Hybrid workers have the longest workdays (+1 hr vs. single-location workers) yet show lower productive time (-8 mins or more) and focused time (-12 mins). In contrast, remote-only workers excel in total productive time and session length, while office-only workers have higher focus efficiency and healthier work patterns.
Organizations mirror these trade-offs: remote-first companies enable longer productive sessions but struggle with employee overutilization, while office-first companies achieve better focus efficiency but face higher rates of underutilization. [Data Set C]
Utilization Trends


Work Location
Return-to-Office (RTO) Impact
Case Study Five companies representing 1,285 employees implemented significant RTO policies in April 2024 and found:
- In-office workers grew 205% over 11 weeks, stabilizing at 67%
- 4 of 5 companies maintained workday start and end times pre- vs post-RTO, with only a 2-10 mins differential
- Post-RTO productivity varied — some companies improved while others declined
This data suggests the future of work is not one-size-fits-all, but requires integrating diverse work models to align with employer-employee goals.
Resources
53% of remote-capable workers work in some form of hybrid arrangement and 60% say they prefer hybrid over fully remote or fully on-site. (Gallup)
AREA OF STUDY
AI Adoption & Impact
The Lab studied:
- How do organizations leverage AI tools?
- Have employee work habits and productivity been impacted by the increased accessibility of generative AI tools?
Key Findings:
- 58% of employees now use AI tools — a 107% increase.
- AI users show consistently longer workdays (+8 mins) and lower focus time (-27 mins).
AI Adoption & Impact
AI Adoption & Impact Trends
- The workplace saw dramatic growth in AI tool adoption, with 58% of employees using AI tools, up 107%. Similarly, the average daily AI tool usage increased 48%, with employees spending nearly 10 mins per day using a wide variety of AI tools.
Companies of all industries and sizes showed an increase in AI tool adoption. Logistics has the largest percentage of AI tool users (72%), followed by Media (71%) and Legal Services (66%), whereas Healthcare has the lowest adoption (44%) but the greatest gain (+193%). AI adoption ranges from 58% to 63% across businesses of all sizes.
Top AI Tools by Adoption

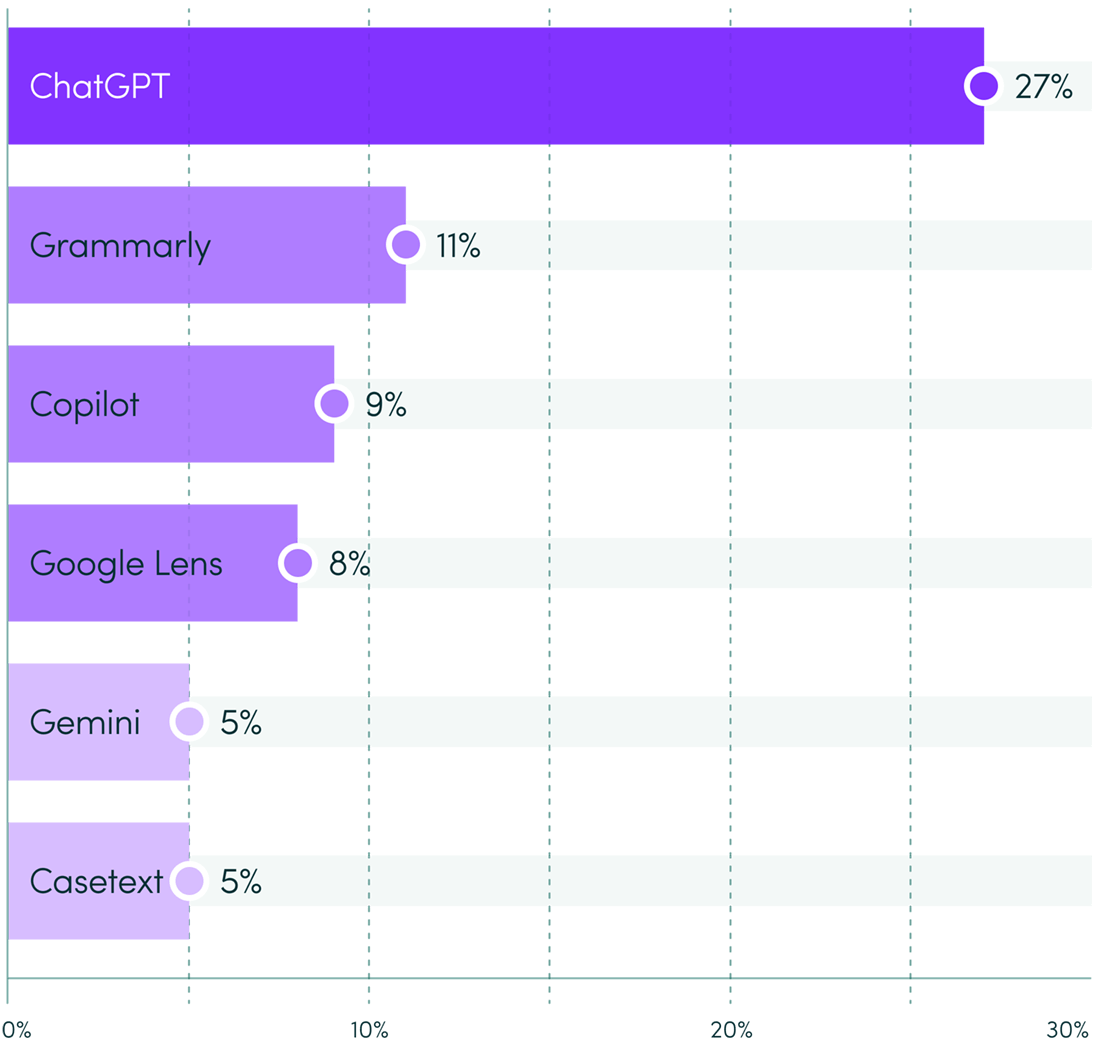
- Notably, the impact of AI tools on work patterns is significant. AI tool users consistently have longer workdays than non-users (though the gap has narrowed from 60+ mins to 8 mins) but less focus time (-27 mins). AI tool users also demonstrate higher collaboration rates (+17 mins) and increased multitasking behavior (+8 mins).
- As AI tool adoption trends upward, organizations must guide employees on best practices for using approved tools. While data shows opportunities for productivity gains, it also reveals the need to balance potential benefits with focused work time. Successful and effective integrations must preserve the essential elements of focused, deep work that cannot be automated.
Resources
31% of companies consider AI skills a top concern, but only 17% are investing in developing workers’ skills. (Deloitte)
Methodology
This report is based on quantitative data collected via ActivTrak’s workforce analytics platform. It reflects actual user behavior recorded between January 1, 2022 and December 18, 2024 through a uniquely coded intelligent agent network. To better understand a range of employee experiences, this report leverages three data sets. Unless noted, Data Set A is used.
Data Sets
Primary Data Sample (A)
# companies
777
# users
218,900
# hours analyzed
303,216,055
Single Time Zone Data Sample (B)
# companies
613
# users
45,439
Work Location Data Sample (C)
# companies
147
# users
41,924
Customer Data Privacy
ActivTrak has the right to use, store, disclose, transfer, exploit, collect, develop, create, extract, compile, synthesize, analyze and commercialize all information, data, statistics and other content derived from Aggregated Data (collectively, “Blind Data”). Blind Data will be owned solely by ActivTrak and may be used for any lawful business purpose without a duty of accounting to Customer. “Aggregated Data” means Customer Data that is: (i) anonymized and not identifiable to any person or entity; (ii) combined with the data of other customers or additional data sources; and (iii) presented in a way which does not reveal Customer’s identity.
Demographics

Glossary
Burnout
Employees at risk spend >75% of their time overutilized annually.
Capacity
Total number of productive hours worked as a percentage of expected productive hours.
Collaboration
Work time that occurs through two-way communication using digital collaboration tools like meeting software, and chat and messaging applications.
Disengagement
Employees at risk spend >75% of their time underutilized annually.
Efficiency
The percentage of productive, focus or collaboration time relative to total time.
Focus
Work time when an employee is engaged in a single task without interruptions, attention shifts or collaborative activities.
Focus Session
The average time employees operate without multitasking (interruptions or attention shifts) and collaboration activities.
Healthy Utilization
When an employee is within +/-% threshold of their daily productive hours goal.
Hybrid
Across the workforce, office and remote workdays are relatively balanced, with neither accounting for more than 60% of total working hours.
Multitasking
Work time spent in productive applications that consists of general administrative business tasks with attention shifts.
Office-first
When employees collectively spend more than 60% of their work days in an office location, indicating a primarily office-based work model.
Office-only
When all employees within an organization spend 100% of their work days in an office location.
Overutilization
When an employee is more than X% over their daily productive hours goal (percentage goal set by employer).
Productive Session
The average time employees work without unproductive disruption. This is calculated by counting the number of non-business activities per total hours.
Productive Time
Time spent engaging with productive apps and sites that includes focused, collaboration and multitasking activities per person, per day.
Remote-first
Employees collectively spend more than 60% of their work days in remote locations, indicating a primarily remote work model.
Remote-only
All employees within an organization spend 100% of their work days in remote locations.
Total Time
The average time an employee spends on a computer screen.
Underutilization
When an employee is more than X% under their daily productive hours goal (percentage goal set by employer).
Unused Capacity
Equal to expected productive hrs/day minus actual productive hrs/day (default for calculations is 7 hrs). When expressed as a percentage, user capacity + unused user capacity equals 100%.
Utilization
A measure of employee engagement and well-being based on average productive hrs/day relative to the goal set for their team.
Weekend Work
Two or more hours on at least one weekend day.
Workday
Time between the first and last activity reported on an employee’s computer.


 Of all the pasta shapes, this one is so cute I want to bite it. But I’ll have to make them first")


