


By Reed Cassady, CFA, | Sam Peters, CFA | Jean Yu, CFA
Adapting to Rapid Risk Events – Market Overview
One of the biggest challenges with risk management is that correlations are non-stationary: they jump around and raise portfolio risk when correlations spike. We endured such a correlation spike early in the third quarter: stocks that had anything to do with artificial intelligence (AI) traded down as a single block, while many cyclical value stocks also joined in the downside pain. This resulted in downside capture that was above our desired target level and required us to adapt the portfolio to a higher-risk environment.
During these kinds of risk events, we look to dynamically adapt the portfolio by using a decision-making process developed by former Air Force fighter pilot Colonel John Boyd called the OODA loop (Observe, Orient, Decide, Act). The advantage of this framework is that we can observe and react to a rapidly unfolding risk event quickly and collectively (Exhibit 1).
The markets often generate more noise than signals, which makes portfolio calibration challenging, as it can be easy to overreact to false positives. We recognize that this means there is a much greater probability that the short-term volatility we see in the markets is merely turbulence, requiring little to no action, versus the odds that it is a true negative signal reflecting fundamental shifts we are unprepared for and that require taking substantial action. Consequently, most of our OODA loop exercises result in little to no need for adjustments. However, such a framework allows us to quickly and decisively respond when action is called for. We believe this was highly valuable during the third quarter.
Exhibit 1: OODA Loop Proves an Effective Decision Framework
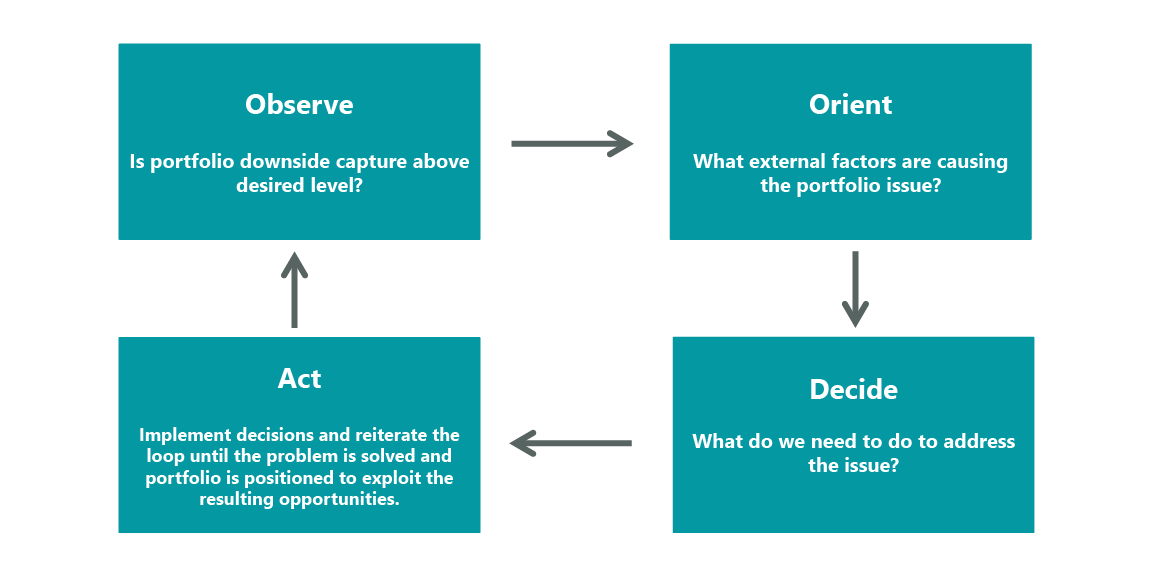

The first step of the OODA loop, Observe, is to assess the portfolio to see if there is a risk problem that needs addressing, namely when downside capture increases well above our target levels and starts to cluster together. While some level of downside risk is a normal part of life for a highly active valuation-disciplined investor, like us, we have pursued several strategies to improve our downside capture over the last few years. However, we began to see such a risk event manifesting in mid-July, triggering this process and initiating the next step.
The second step, Orientation, is in some ways the most challenging and critical of the entire framework. It requires us to assess the root cause of the problem and often leads to additional questions: Why is the portfolio suddenly experiencing this problem? What degree of portfolio change is required to address the issue? Is this likely to be a common short-term risk event that passes quickly, or a big transition in markets, which occur much less often? Fortunately, addressing the root cause of the problem is often not as noisy as it appears, as it can be directly observed within the portfolio: What specific stocks that we own or do not own are causing the downside problem?
During July, we saw a massive downside correlation spike in everything related to AI where we had exposure primarily through power stocks, like Vistra (VST) and Constellation Energy (CEG), and in semiconductor stocks, like Micron (MU) and Marvell (MRVL). We also experienced similar downside in cyclical stocks we owned from mounting concerns about the ongoing economic malaise in China and potentially slowing growth in the U.S. At the same time, defensive stocks, like utilities, consumer staples, and health care, all started to bounce materially higher in a violent rotation that current markets are prone to. Although we had previously trimmed our AI-leveraged stocks on strength and had added materially to defensive areas, especially during last October’s defensive stock correction, these shocks suggested that we needed to make further adjustments to our positioning.
After orienting ourselves to the specific stocks causing issues, we quickly moved to the next two steps of the loop: Decide and Act. Specifically, we raised our health care exposure by about 4% and sold down some of our power and cyclical stocks, specifically financials, that were subject to the most downside volatility. We then returned to the orientation stage, as the loop runs iteratively until we start to see downside capture within our targeted levels or until the risk storm passes. We started to achieve this primary goal by early August, with downside capture moderating even as volatility spiked violently again.
The team uses this framework to continuously orient and adapt to potential changes in market dynamics, with the goal being to decide if a risk event is powered by a major change in the economy and markets or if it is simply a technical-driven event. By employing the OODA loop to address these broader issues, we can more decisively determine if we need to make significant changes to the portfolio to adapt to a new and lasting market environment, or if this is more of a tactical opportunity to provide liquidity to forced sellers. In the case of the July turmoil, we determined it was a technical selloff and, when downside capture got within our targeted range, we capitalized on the opportunity to play more offense. This active and dynamic tension between defense and offense is exactly what the OODA loop process allows, but how did we decide between structural and tactical risk in this case?
Our main recession risk metric to watch has been credit spreads, which did indeed widen modestly in July, but nowhere near levels signaling an imminent recession, and they quickly reverted to historically benign levels (Exhibit 2). In addition, there have been no recessions without both a spike in interest rates and energy prices. Over the last few years, the great economic surprise is that the U.S. economy has avoided a recession despite interest rates climbing from 0% to over 5%, along with the energy price spike that ensued after Russia’s invasion of Ukraine. However, with interest rates and energy prices now dropping, we are seeing financial conditions loosen materially, and recession risks seem to be receding.
Once we decided that the probability of fundamental risks to the economy had not shifted materially higher, we delved deeper and determined that the risk-off technical selling was likely an unwinding, or “degrossing,” of the Japanese carry trade. For years, the Japanese carry trade had been extremely profitable, as investors could borrow in yen at zero rates and buy higher-yielding assets. This accelerated as Japan became the last big pool of free money in the world, causing the yen to depreciate versus other currencies, effectively allowing investors to borrow for free and pay the loan back in cheaper currency, causing speculators to crowd into this trade. This created a very unstable position, and all it took was the Japanese central bank to raise interest rates by 0.25% and the yen to start rising for the party to abruptly end. The result was forced selling that fed on itself, culminating in a volatility spike that mirrored past crises of much greater magnitude.
Exhibit 2: Credit Spreads Spike, then Sink
As of Sept. 30, 2024. Source: Bloomberg Financial, L.P., ClearBridge analysis.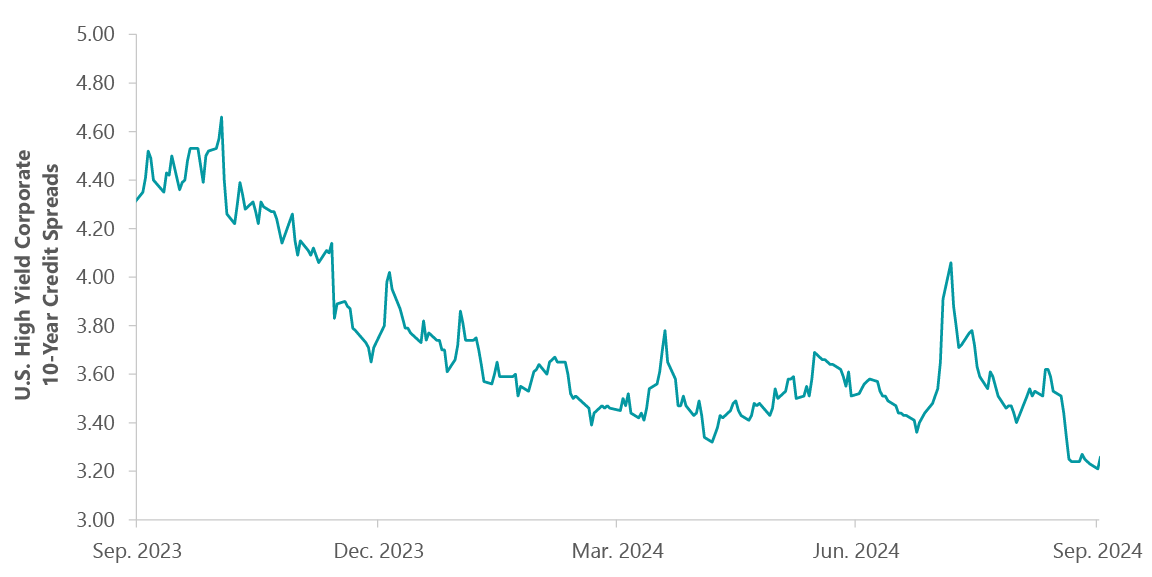
This is the paradox of risk: investors hate price volatility, yet the market has become increasingly casino-like with record amounts of leverage and short-term options trading. By far, the most popular table at the market casino is the U.S. equity market, and specifically the S&P 500 Index. Leveraged and derivative-related bets on the S&P 500 had grown to over $240 trillion by 2023 versus the $40 trillion market cap of the underlying index. These are a huge source of structural volatility, as it does not take much to precipitate technical selling that feeds on itself. This results in a knock-on effect as traditional long-only investors looking to reduce volatility sell at the same time, resulting in the market sending false fundamental signals with increasing intensity. Look no further than the recession of 2023 that never happened, or the violent Treasury market selloff last October that had many defensive stocks down double digits in a couple of weeks.
With investors increasingly managing risk through a single and crowded lens of reducing tracking error to ever more leveraged indexes, the OODA loop framework serves as a crucial tool in our risk management process to help navigate these volatility storms.
However, we also remind shareholders that our focus on managing risk is much broader, with a goal of compounding shareholder wealth through a complete market cycle. To do this, we must avoid permanent losses of capital that result from leverage, excessive valuations and disruption risk when business value is permanently impaired. This is why we employ an absolute valuation discipline that looks for material gaps between price and intrinsic value, focus on well capitalized companies that can withstand economic pressure and continually stress-test long-term fundamentals through our detailed investment cases.
However, it does not need to be an immediate crisis to employ OODA loops, and we are continuously running them in the background in regard to events such as the upcoming election and ever-increasing geopolitical risk. However, our current downside capture is back within our desired parameters, and we think the market is broadening out more akin to what we had anticipated, and we believe our portfolio is positioned to take advantage of it. We continue to have lower absolute valuation metrics than our respective index but with roughly 50% greater expected growth in earnings and free cash flow over the coming year.
Quarterly Performance
Stock selection in the industrials sector weighed on performance, as slowing economic growth and persistent destocking trends pushed investor expectations of a rally in the second half of 2024 into 2025. This included Atkore (ATKR), which makes electrical, mechanical, safety and infrastructure products and solutions such as conduits, cables and mechanical pipes. The company faced stiff headwinds stemming from increased costs of inputs from Mexico, resulting in quarterly earnings that fell below market expectations.
Conversely, stock selection in the utilities sector was a positive contributor, led by Vistra and Constellation Energy. Both power production companies continued to rise due to the long-term expectations of power price strength on the back of greater electricity demand from AI development and implementation. Additionally, recent industry deals with leading AI developers, such as Constellation’s agreement to restart its Three Mile Island nuclear reactor to supply power to Microsoft data centers, for dedicated power generation services at prices significantly higher than prevailing market rates suggests that similar deals are likely and will benefit these companies long term.
Portfolio Positioning
We added several new positions during the quarter. Our largest was UnitedHealth Group (UNH), a leading diversified health care company that offers health insurance through its UnitedHealthcare segment and health services through its Optum division. Despite the market’s concerns surrounding rising competition within the Medicare Advantage (MA) market, we believe the company has a strong portfolio of more profitable MA plans than its competitors, and that its decision to not pursue unsustainable benefit plans over the last few years is paying off.
Our largest sell during the period was Union Pacific, in the industrials sector, which operates in a railroad business in the U.S. transporting a wide range of commodities, materials, work-in-progress and completed products via intermodal containers. The company continues to face headwinds plaguing the broader industrials sector, including slowing economic growth and destocking trends, as well as pressure from a prolonged freight recession with little visibility into the timing of speed of recovery. Additionally, with the prospect of added uncertainty surrounding its upcoming union negotiations in November, we elected to exit the position in favor of other, higher-conviction opportunities.
Outlook
We can only capture very mispriced fundamental opportunities by venturing beyond the “safety” of historically expensive but lower-volatility indexes. This differentiated and active valuation discipline will inevitably result in some disappointing quarters like this last one, but we have the processes in place, like OODA loops, that help us adapt, learn and continually improve. Most importantly, the advantaged valuation and fundamental characteristics of our portfolio are a continuously compounding advantage that makes the inevitable short-term turbulence worth navigating.
Portfolio Highlights
The ClearBridge Value Equity Strategy underperformed its Russell 1000 Value Index during the third quarter. On an absolute basis, the Strategy had positive contributions across eight of the 11 sectors in which it was invested during the quarter. The leading contributors were the utilities and financials sectors, while the energy and consumer discretionary sectors detracted the most from performance.
On a relative basis, overall stock selection and sector allocation effects weighed on returns. Specifically, stock selection in the financials, industrials, information technology (IT), consumer discretionary and energy sectors, as well as an overweight to the energy sector, detracted from performance. Conversely, stock selection in and an overweight to the utilities sector proved beneficial.
On an individual stock basis, the biggest contributors to absolute returns in the quarter were Vistra, GE Vernova (GEV), Constellation Energy, Gilead Sciences (GILD) and Fiserv (FI). The largest detractors from absolute returns were Micron, Noble (NE), Atkore, Skyworks Solutions (SWKS) and Biogen (BIIB). During the period, the closure and consolidation of the ClearBridge All Cap Value Strategy into the ClearBridge Value Strategy (formerly ClearBridge Value Equity) resulted in the portfolio receiving several new holdings that we are currently evaluating for inclusion but may be gradually eliminated at the conclusion of this transition period. As a result, in addition to the transactions listed above, we initiated new positions in Atlas Energy (AESI) in the energy sector, GXO Logistics (GSO), Johnson Controls International (JCI) and WillScot (WSC) in the industrials sector, American Homes 4 Rent (AMH) in the real estate sector, Haleon (HLN) and Lamb Weston (LW) in the consumer staples sector, Gen Digital (GEN) and Skyworks Solutions (SWKS) in the IT sector, Medtronic (MDT) and Novo Nordisk (NVO) in the health care sector, M&T Bank (MTB), Global Payments (GPN) and Fairfax Financial (OTCPK:FRFHF) in the financials sector, Vulcan Materials (VMC) and Silgan (SLGN) in the materials sector, T-Mobile US (TMUS) in the communication services sector and Murphy USA (MUSA) in the consumer discretionary sector. During the period, we exited holdings in Airbus (OTCPK:EADSF), Atkore and Flowserv (FLS) in the industrials sector, Microsoft (MSFT) in the IT sector, Las Vegas Sands (LVS) and Expedia (EXPE) in the consumer discretionary sector, Kellanova (K) in the consumer staples sector, United Utilities (OTCPK:UUGWF) in the utilities sector and Biogen in the health care sector.
Reed Cassady, CFA, Managing Director, Portfolio Manager
Sam Peters, CFA, Managing Director, Portfolio Manager
Jean Yu, CFA, PhD, Managing Director, Portfolio Manager
|
Past performance is no guarantee of future results. Copyright © 2024 ClearBridge Investments. All opinions and data included in this commentary are as of the publication date and are subject to change. The opinions and views expressed herein are of the author and may differ from other portfolio managers or the firm as a whole, and are not intended to be a forecast of future events, a guarantee of future results or investment advice. This information should not be used as the sole basis to make any investment decision. The statistics have been obtained from sources believed to be reliable, but the accuracy and completeness of this information cannot be guaranteed. Neither ClearBridge Investments, LLC nor its information providers are responsible for any damages or losses arising from any use of this information. Performance source: Internal. Benchmark source: Russell Investments. Frank Russell Company (“Russell”) is the source and owner of the trademarks, service marks and copyrights related to the Russell Indexes. Russell® is a trademark of Frank Russell Company. Neither Russell nor its licensors accept any liability for any errors or omissions in the Russell Indexes and/or Russell ratings or underlying data and no party may rely on any Russell Indexes and/or Russell ratings and/or underlying data contained in this communication. No further distribution of Russell Data is permitted without Russell’s express written consent. Russell does not promote, sponsor or endorse the content of this communication. Performance source: Internal. Benchmark source: Standard & Poor’s. |
Original Post
Editor’s Note: This article discusses one or more securities that do not trade on a major U.S. exchange. Please be aware of the risks associated with these stocks.
Read the full article here


")


")
