


")


Thesis
General Mills (NYSE:GIS) is a company investors buy stakes in not because of the need for outperformance, but because of its reliable dividend, standing at 35 years without a reduction, and its solid business model. Even more so, I argue that General Mills comes close to representing an “equity bond” – a term I recently came across in another article and would like to adopt for stocks like General Mills. Now, one step at a time, I would like to guide you through why I like stocks like General Mills, by
- firstly, focusing on its dividend yield, comparable real interest rates, inflation, and valuation,
- then discussing how the operating business is doing,
- before also going into company- and industry-specific risks.
Inflation Protected Income
GIS currently yields a dividend of 3.6%, comfortably above its five- and ten-year averages of 3.2% and 3.3%, respectively. This does not necessarily indicate an undervaluation, though because we are comparing with averages from times dominated by low interest rates. It does, however, indicate an attractive yield at first glance. Now come the usual objections that one can lock in a better return of 4.4% for 30 years with low-risk government bonds. In response, the usual argument is that stock yields have to be interpreted including growth on top, which is exactly right but doesn’t help to argue in favor of GIS, obviously not known as a growth company.
GIS historical dividend yields (blue line), 5- and 10-year corridors & averages. (Aktienfinder.net)
However, I argue that General Mills’ dividend is at least inflation-protected. While I have not researched this myself, I have read in several papers that earnings and dividend yields are essentially to be interpreted as inflation-protected in nature. I took this as an occasion to conduct a quick and simplified analysis regarding GIS.
To begin with and just to recap, see below the yields on 30-year treasury bonds, which are nominal yields and therefore include an expected compensation for inflation.
multpl.com
But, when comparing the arguably inflation-protected dividend of a consumer staple, I feel the comparison is more logical with the real yields on inflation-protected bonds, the so-called TIPS. Here, we stand at 2.2% versus a 3.6% dividend yield on GIS. For some, this 1.4% premium might still be a small risk reward for equity, but there are two further aspects I would like to consider.
multpl.com
First, we are assuming absolutely no growth beyond inflation in this comparison, which is somewhat conservative, although there is not much real growth in sight for GIS. Secondly, GIS – at least statistically – is as decoupled from the overall market as it gets, resulting in almost no Beta at all, according to Seeking Alpha 60- and 24-month regressions standing at 0.11 and 0.03, respectively. Even when applying the Blume adjustment formula to the higher Beta of 0.11, landing at a Beta of 0.4, I calculate a Cost of Equity of only 6.4%. Comparing this to the 3.6% dividend yield, GIS would need 2.8% nominal annual growth as of today – not much higher than long-term inflation expectations. All this makes me feel confident about GIS’s current valuation. My observation of GIS being decoupled from overall markets is backed by an BofA analysis, that identified some of the most idiosyncratic stocks. This means stocks are influenced more by company-specific factors rather than general market trends.

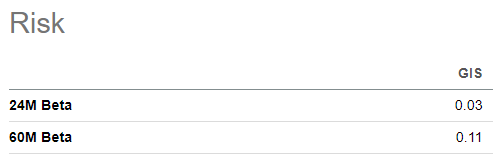
Seeking Alpha
As indicated earlier, besides Beta, the name of this consumer staples’ game is keeping up with inflation. With 58% of revenues being generated in the US, 5% in Canada, 23% in the rest of North America and the remaining portion internationally, I deem the US inflation rate an appropriate proxy for my analysis.
multpl.com
Please find below a compact dashboard summarizing the YoY growth rates for GIS’ adjusted EPS, revenue per share and dividends per share. For the sake of simplicity, I have not considered dilution or M&A effects, implicitly assuming that GIS’ core business is the primary long-term driver of these figures. But, for example, this year’s expected per-share revenue growth can be solely attributed to share repurchases, given stagnant company revenue. Since General Mills’ fiscal year runs from June to May, I have compared these YoY growth rates to inflation rates as of the beginning of June each year to ensure a consistent annual cycle. While there appears to be no correlation between dividends and inflation or between earnings and inflation, there is a weak correlation between revenue growth and inflation in the same year, and a very strong correlation with a one-year lag, suggesting a delay until price increases are fully realized.
Author | Data: Aktienfinder.net, multpl.com
The lack of correlation between dividends and inflation should not be overstated due to the short observation period lacking statistical significance. Additionally, dividend increases have sometimes been significantly higher than revenue growth, or in the opposite were stagnant, particularly during the pandemic period. The absence of a correlation between earnings and inflation is likely due to the fact that earnings have generally outperformed inflation-dependent revenue. This can be attributed to over-inflationary profit growth driven by efficiency gains and cost management.
In conclusion, despite the limitations of this analysis, particularly the lack of a strong correlation on the earnings side due to the discussed effects, there seems to be some evidence of inflation protection on the top line, which in the long run should also lead to inflation protection of earnings and dividends. This underscores that using real yields of 2.2% would be a more appropriate number to compare to General Mills’ dividend yield at 3.6%.
I Like This Boring Business
Now that we’ve explored some technical aspects, let’s delve deeper into General Mills’ operating business. We’ll begin by examining the most recent developments and gradually broaden our scope.
- Firstly, it is important to note that General Mills is scheduled to release its fourth-quarter earnings report on June 26, 2024.
- In the most recent quarter having ended in February, GIS posted -1% organic net sales, driven by -2% in volume that could not fully be offset by +2% in pricing / mix. Over the course of nine months, organic net sales grew +1%, implying +4% in pricing / mix, given -3% in volume. So it shows that moderating inflation is impacting pricing power, yet even more problematically, price elasticities start to wipe out price increases through volume shrinkage. Noteworthy, however, is that adjusted operating profits and EPS could grow high single digits to low double digits in the quarter as well as over nine months.
- General Mills is stepping up its Pet Food game. Recent acquisition news include those of Fera Pets in the market of evidence-based premium pet food and European premium natural pet food brand Edgard & Cooper. Given an increasing humanization of Pet Food and demographic and societal shifts towards pets winning importance in people’s lives, I deem this a promising strategy.
- On the divesture side, GIS is looking to sell its yoghurt business, currently attributing USD 250 million EBITDA to the company.
- Over 5 years, GIS looks back at an average mid-single digit growth across organic net sales, adjusted operating profit and EPS.
- Over the very long term, I would like to let the charts below speak, indicating extremely stable operating margins, an upward trend of net margins and all of that despite pressure on gross margins over time. What I also like seeing is Free Cashflow conversions around 100% on average. Dividend is somewhat of a priority, evidenced by fluctuating payout ratios, after all mostly amounting to healthy ratios roughly within the 50% to 70% range. This is also an explanation why the dividend does not necessarily correlate with inflation because it follows a prioritized growth pattern, which is cushioned by the payout ratio compared to operational fluctuations.
Green line – net margin, red line – operating margin, blue line – gross margin, percentages depicted on the right axis. (Aktienfinder.net)
Orange – adjusted EPS, brown – Fee Cashflow per share, blue – Dividends per share, USD per share on the left axis, black line – payout ratios – percentages depicted on the right axis. (Aktienfinder.net)
- Talking long-term orientation, I would like to depict GIS’s diversified product segments below, just to bring it to mind.
General Mills
- Looking ahead, GIS has had to lower its current fiscal year guidance from mid-single digit revenue growth to -1% or flat development during the year. Profit guidance, on the other hand, has remained largely unchanged, only narrowing the corridor around the mid-single digit YoY range. Mid-single digit is also the magic word for the group’s long-term guidance on earnings. In terms of sales, GIS is almost precisely targeting long-term inflation expectations of 2-3% annually.
Key Risks
Lastly, let’s summarize key risks for GIS in the continued bullet-point-manner:
- Input cost inflation is often cited as a significant risk. While on the one hand this is of course relevant and has put gross margins under a bit of pressure, on the other hand, in the long term, none of this has had a particularly serious impact on the group – and this is despite unprecedented times of inflation within in the recent past.
- A high level of goodwill is noticeable in the balance sheet, which at USD 14.4 billion exceeds the balance sheet equity of USD 9.7 billion.
- One author correctly claims: “General Mills is facing challenges in sales due to increased competition from store brands and changing consumer spending habits.”
- General Mills’ share price may also have suffered from news about the feared effects of appetite-suppressing drugs. The concern was that such drugs could change consumer behavior to the detriment of corporations. However, CEOs of consumer staples giants themselves hardly share this fear. I have also come to the conclusion that, on the one hand, I do not believe that medication will disrupt demand at an alarmingly rapid pace, and, on the other hand, I trust in the companies’ ability to adapt to the health needs of consumers. See an excerpt of this news article for example: “Food manufacturers (…) have been confident this year that they can adjust to the weight-loss drug disruption that is forecast to continue to grow. Notably, the industry has pointed to data that showed consumption of better-for-you frozen meals increased by a notable amount in people taking weight-loss drugs, even as consumption in some snacking and dessert categories has fallen off.”
- Finally, be aware of Q4 earnings ahead on June 26, 2024.
I Am Loading Up On This Income Play
General Mills, with its current portfolio, is well positioned in boring yet appealingly stable consumer sectors, offering little operating upside. However, the strategic expansion in the Pet Food segment meets the spirit of current times, which is why I assess these moves positively. General Mills’ virtually inflation-protected dividend offers a slight risk-premium over inflation protected bond yields. Although real growth is limited, I am content with this small premium, as the company appears widely decoupled from the overall stock market. Therefore, GIS can be viewed as a stabilizing and passive inflation-protected income investment within a diversified portfolio, while offering little perspective for outperformance. Risks include the company’s high goodwill, struggling customers in the short- to medium-term and medium- to long-term changes in consumer behavior.
Read the full article here


")
 Married With Children’s Ed O’Neill tells the story of how he was cut from the Pittsburgh Steelers")
