

")


Editor’s note: Seeking Alpha is proud to welcome Rahul Gupta as a new contributing analyst. You can become one too! Share your best investment idea by submitting your article for review to our editors. Get published, earn money, and unlock exclusive SA Premium access. Click here to find out more »
Strategy of diversified investment.
Co-authored with Ajay Somani
Introduction
Historically, the negative correlation between stocks and bonds has been a cornerstone of the 60/40 strategy, providing a hedge against market volatility and economic downturns. However, recent shifts in market dynamics, particularly the increasing correlation between these asset classes during periods of high inflation, have challenged the effectiveness of this traditional allocation. This white paper explores the evolving relationship between stocks and bonds, the impact of inflation on asset correlations, and the potential for incorporating commodities as a dynamic hedge to enhance portfolio performance in the current economic environment.
Efficient frontier and the 60/40 portfolio
The most ubiquitous chart in asset management is the efficient frontier from Modern Portfolio Theory. MPT was developed in 1953 by Nobel laureate Harry Markowitz. It highlights that given the characteristics of two securities (returns, volatility, correlation), there is an optimal allocation which maximizes the Sharpe ratio. This insight led to the birth of 60/40 asset allocation approach.
The name 60/40 is genius marketing, which does exactly what it says. It blends the two most popular financial securities, stocks and bonds, in a 60/40 ratio. US investors in particular have always been on board with the economic growth story and have shown high confidence in the stock market. However, there are periods of crisis such as the 2001 Tech bubble or the 2008 Credit crisis which they are afraid of. Allocating a part of their portfolio to bonds has hedged them during those crises. Thus, the driver behind the proliferation of 60/40 portfolios was investors’ need to balance the highest returns relative to the risk appetite. This is a good example of “meeting in the middle” where investors want high expected returns from stocks, and also the stability offered by the bonds.
The main promise or the hidden magic behind the 60/40 is the presumed negative correlation between stocks and bonds. Figure1 from Robeco’s article shows how the efficient frontier changes based on the correlation. Higher correlation reduces the benefits of bonds in the portfolio. Per AQR’s paper, If the stock-bond correlation rises from -0.5 to +0.5, 60/40 portfolio’s volatility increases by around 20%.
Figure1:
1. Robeco. (2024). New Research into the Stock-Bond Correlation Shows When They Correlate and When They Don’t. Retrieved from Robeco

Historical Expectations and Recent Shifts in Stock-Bond Correlation
Over the past three decades, the investment community has come to expect a negative correlation between stocks and bonds. This has been driven by the 30-year bond bull market that ended after central banks started to increase rates post-Covid. Figure 2 shows rolling 2-year monthly correlations between stocks and bonds. We observe that the correlation changed to significantly positive over the past few years.
Figure 2:
Author’s Compilations

This has come as a surprise to investors who had become used to the benefits of allocating part of their portfolio to bonds. Figure 3 shows the interest in the search term “stock bond correlation” picked up after 2022, indicating that people were trying to learn more about this behavior.
Figure 3:
Google trends

Data Used
For our analysis, we utilize total return index data sourced from Bloomberg. Specifically, the data is represented by the following tickers: Equity (SPTR Index), Bonds (SPUSTTTR Index), and Commodities (SPGSCITR Index). In our discussion, we will refer to the equity index as “SPX,” the bond index as “TY,” and the commodity index as “GSCI,” in alignment with the indices mentioned above. The data in focus is from 1990-2024.
Asset allocation benefits
In its negative correlation state, bonds in a portfolio hedge against the stock market volatility and in particular losses due to growth uncertainty. Inflation is one of the primary drivers of higher stock-bond correlation. In higher inflation, the correlation increases because central banks increase yields to combat inflation, which leads to bond prices falling. An increase in yields hurts the growth stocks the most because the cost of funding rises more significantly than the uncertain future growth rate. The table below notes some example driver/effects on stocks and bond co-movements.
|
Bonds Up |
Bonds Down |
|
|
Stocks Up |
|
|
|
Stocks Down |
|
|
Given the primary intuition behind the 60/40 blend portfolio is diversification, it naturally follows that when the correlation is positive, we do not get the diversification benefit. Further, during high inflation the stocks come down (margin getting compressed, demand getting lower) and central banks leap into action to curtail inflation by raising interest rates. During this time period, the 60/40 portfolio suffers the most, as we saw in 2022 as the portfolio was down 15% on the back of increasing inflation and thus correlations.
Inflation hedge
A natural question is what happens if we allocate some capital from bonds, which underperform in higher inflation, to another asset which outperforms in higher inflation. Commodities are known to be a good inflation hedge. If commodities are a good inflation hedge, then it should behave in the opposite way to bonds during inflationary times. Thus, the correlation between stocks and commodities should be negative when inflation increases.
For the purposes of this paper, we use the GSCI total returns, which is a widely used benchmark for commodities. Figure4 shows a rolling correlation of stocks with bonds and stocks with GSCI. We observe that the correlation with GSCI moves in the opposite direction compared to the correlation with bonds.
Figure 4:
Author’s Compilations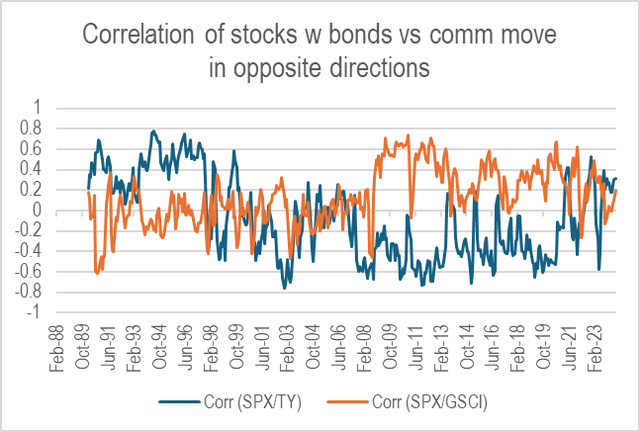

As a next step, we re-allocate some portion of the bonds to GSCI index so that we are hedged during the inflationary periods too. We arbitrarily choose 10% as a threshold and reduce allocation from bonds (bringing it down from 40% to 30% of the portfolio) and allocate the 10% freed-up capital to the GSCI index.
The comparison table presented below indicates that it does not enhance the performance. This is not a surprise as commodities are known to exhibit much higher volatility and are generally in contango, which means they have negative carry and on average lose money over time due to roll costs.
The solution is to be more effective in switching between bonds and commodities, as it would make sense to do so only during higher inflation periods.
|
60/40 |
60/30/10 |
|
|
Annual Return |
8.92% |
8.79% |
|
Annual Volatility |
9.19% |
9.75% |
|
SR |
0.97 |
0.90 |
Dynamic hedging based on macro regimes
The static allocation of 10% to GSCI has been shown to underperform the baseline 60/40 portfolio. A better approach is obviously to use this inflation hedge only when necessary. If we are able to accurately identify market regimes and timely allocate some portion from bonds to commodities, we might be able to improve the performance.
For regime detection, we use stock/bond correlation as a metric. When the current correlation is higher than the previous 6-month correlation, we allocate 2% of the portfolio from bonds to GSCI index at month end. We apply this rule in subsequent months, until we have a maximum of 20% allocation to the GSCI index. When the correlation over the past 6 months starts going down, we re-allocate the weight back to bonds incrementally.
Figure 5 shows how the GSCI weight changes with the correlations. To capture the localized effects of these correlations, we employ a 60-day rolling correlation for the analysis.
Figure 5:
Author’s Compilations

We compute the performance each month, based on the weights allocated to stocks, bonds, and GSCI index at the end of the previous month. The table below shows that this approach improves the performance of the 60/40 portfolio.
|
60/40 |
60/40 w dynamic GSCI |
|
|
Annual Return |
8.92% |
9.44% |
|
Annual Volatility |
9.19% |
9.36% |
|
SR |
0.97 |
1.01 |
The average allocation to GSCI index is 9% which indicates that the benefit we receive is from our dynamic allocation model (as the static 10% allocation had made the performance worse).
Figure 6 plots the value added over time along with the correlation. It’s clear that the value-added increases whenever there is a spike in the correlation.
Figure 6:
Author’s Compilations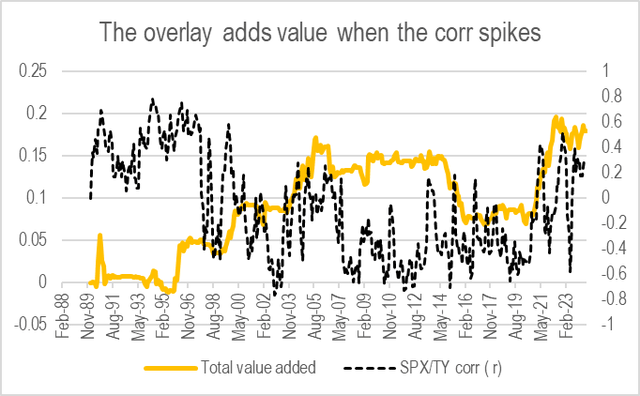

Note, here we have used the 2% threshold arbitrarily. In results not reported in the paper, we have checked the robustness of this threshold and the relationship holds with the perturbed values.
Figure 7 compares the compounded total returns between the baseline 60/40 portfolio and the dynamically adjusted portfolio.
Figure 7:
Author’s Compilations

Conclusion
The 60/40 portfolio has long been a trusted strategy for balancing growth and stability. However, changing economic conditions, particularly the rising correlation between stocks and bonds during inflationary periods, have diminished its effectiveness. By reallocating a portion of bonds to commodities, particularly in times of high inflation, investors can potentially regain the diversification benefits that the traditional 60/40 allocation aims to provide.
Our analysis demonstrates that a dynamic approach, adjusting allocations based on prevailing stock-bond correlations, can improve portfolio performance. The inclusion of commodities, while not a panacea, offers a viable hedge against inflation, mitigating the risks posed by positive stock-bond correlations. As the investment landscape continues to evolve, so too must our strategies. Embracing dynamic allocation models can help investors navigate uncertainty and enhance returns while managing risk more effectively.
Read the full article here

")
")

")
")
