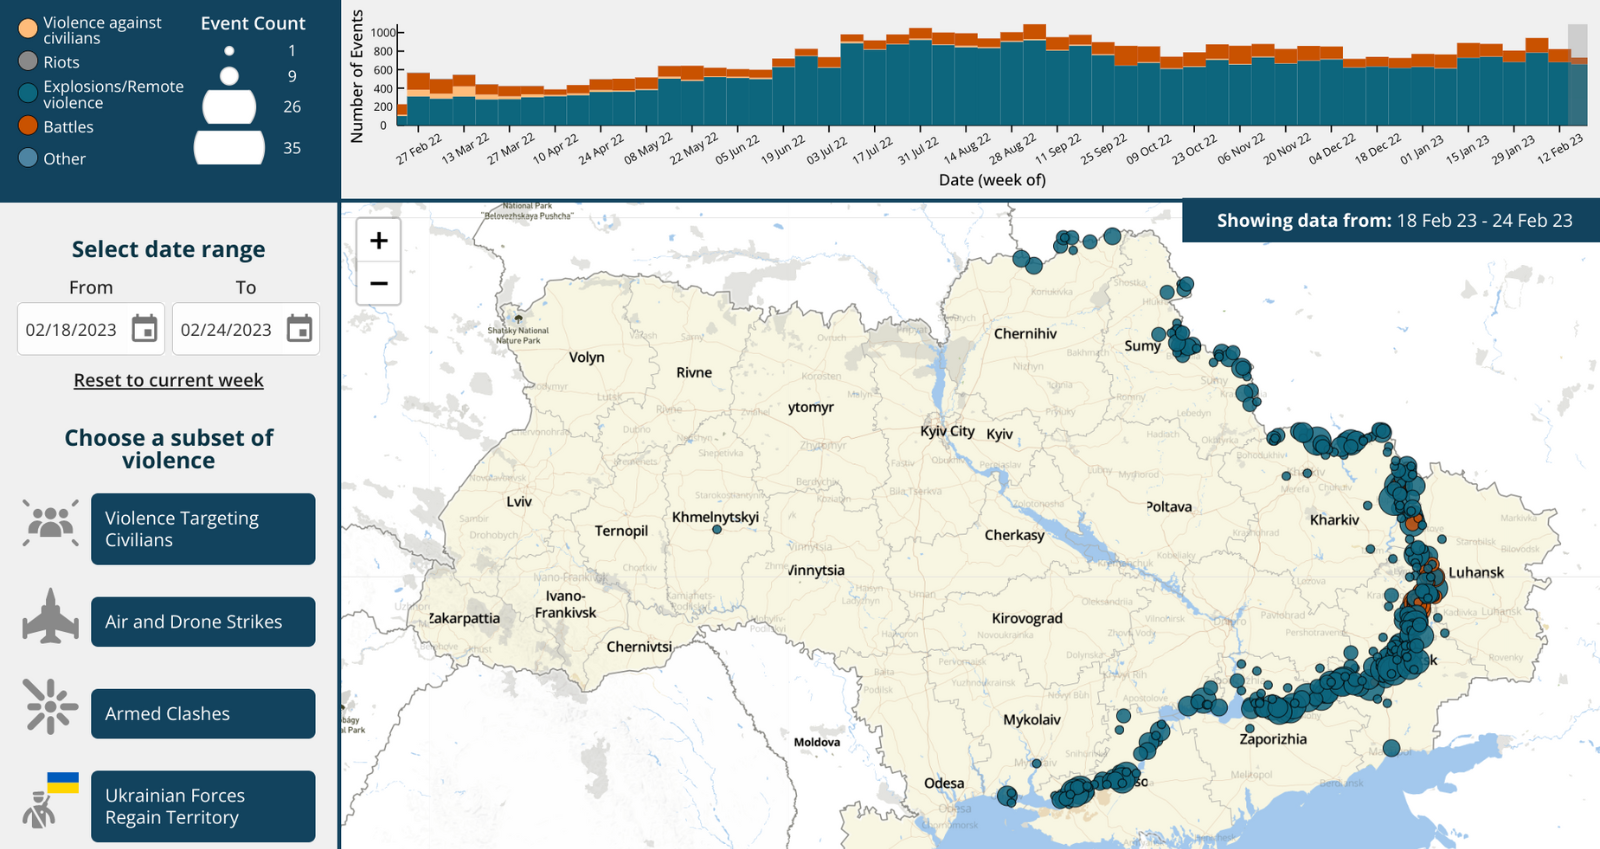
Date and subset filters
By default, the map displays data for the most recent week. Use the date filters to change the date range in view.
Use the subset filters to analyze trends in more detail.
Changing view
By default, the map is set to event view, which uses scaled circles to show events at a given location. Click on a region in Ukraine to zoom in for a more detailed view. Hovering over a region will give a count of events within its borders.
Changing to region (oblast) view will switch the map to a choropleth, giving an overview of event density per region. This will also disable the zoom function.
Events in Russia
While in event view, use the ‘Events in Russia’ toggle to show or hide conflict-related events in Russia. Conflict-related events are identified as follows:
- All events with the ‘Battles’ or ‘Explosions/remote violence’ event type.
- Events with the ‘Violence against civilians’ event type, where the actor is:
- Ukrainian or Russian military
- Russian border guards
- Pro-Ukrainian Russian militias
Event counts and civilian fatalities
The box in the bottom right hand corner displays event counts in total, disaggregated by event type, and filtered by date or subset according to the options already selected.
It also shows a conservative estimate of civilian fatalities, limited to events where civilians are targeted directly. Military casualties are not represented on the map as they are largely unverifiable.
For more information on how ACLED codes fatalities, read our methodology explainer.


