")

 Brendan Fraser yeets Peter Dinklage across a bathroom before water boarding him while demanding some emeralds. Then it gets weird")


By Mandy Xu
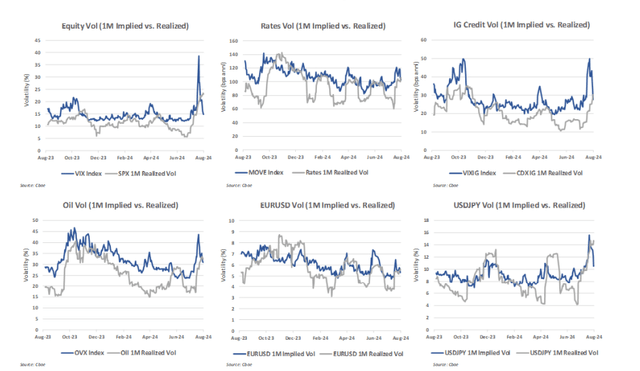
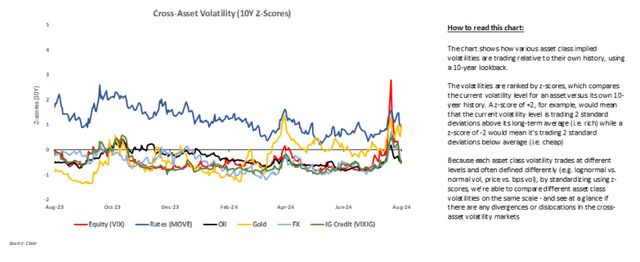
Cross-Asset Volatility: Cross-asset implied volatilities on the whole continued to normalize towards its lower pre-Yen-carry unwind levels on the back of better economic data. Most notable was the sharp wk/wk reversion in USDJPY implied volatilities from its 98th percentile highs at nearly 16% to 10.6% (53rd percentile) as of Friday. NKY implied volatilities followed suit with the VNKY index declining from 45.3% to 26.5%. As a result, the 1M NKY-SPX® volatility spread has tightened considerably and currently trades at just a 1 pt vol premium vs. seasonal historics. The only major asset to evidence higher implied volatility levels was gold (1M imp vols @ 18.0%, 99th percentile) which has seen an increase in bids for downside puts as it broke all-time highs. Nonetheless, with spot gold at $2508, gold skew currently reflects a modest asymmetry to the upside with options traders pricing in ~5% chance that gold rallies 20% above $3000 by year-end vs a ~1% chance it falls -20% below $2000.
Exhibit 1: Cross-Asset Volatilities Lower on Inflation Data
Source: Cboe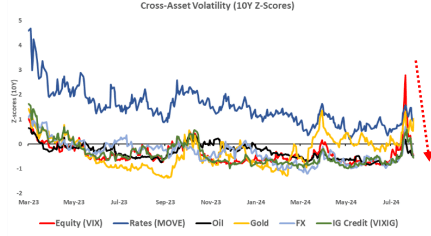
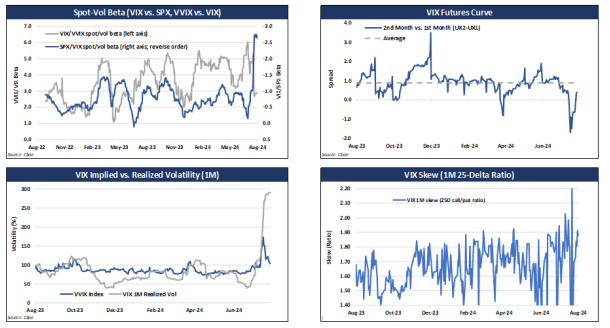
Equity Volatility: Within a span of two short weeks, the US equity markets appear to have made a full recovery from the aftermath of the Aug 5 Yen-carry unwind. Accordingly, we examine whether that shock has had any lasting implications upon the market’s pricing of equity risk. To that end, we referenced the volatility market structure as of July 23, 2024 when the closing price of S&P 500 index was virtually identical to last Friday’s close (5555.74 vs 5554.25).
We find that although the nominal level of expected market risk between the two dates are also similar (VIX® Index at 14.72 vs 14.8) there are 2 significant differences post Aug 5. Whereas ATM SPX implied vols previously traded at a ~1 vol pt discount relative to 1-month exponentially weighted realized volatility (i.e., realized volatility weighted towards the most recent week’s market action) which reflects the demand to harvest yield by selling the implied volatility risk premium, SPX implied vols now trade at a +1 vol pt premium to realized volatility, indicating a net demand for market optionality by paying the implied volatility risk premium. In a similar vein, current vol-of-vol also trades at a 17% premium vs. Jul 23 (VVIX Index = 103 vs 87), signaling heightened uncertainty in the vol regime. While VIX put demand surged in the immediate aftermath of the recent vol spike, with the put/call ratio jumping to near a 1-year high, call demand has picked up in recent days as the VIX index has gone sub-15.
Exhibit 2: Vols Now Embed Positive ImpVol Risk Premium
Source: Cboe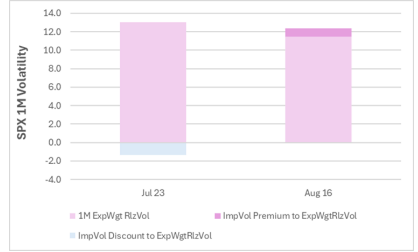
Exhibit 3: VIX Put/Call Ratio Surges to Near 1Y High
Source: Cboe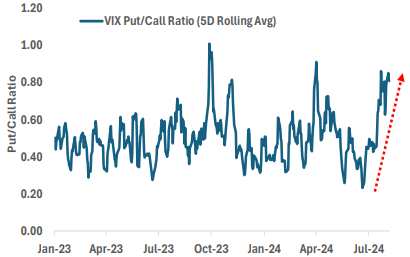
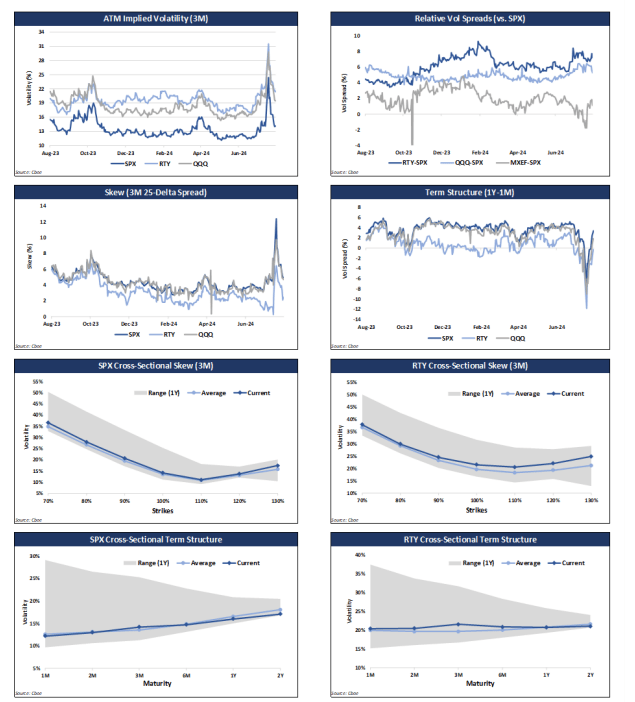
Skew: Skew flattened wk/wk on the strength of the market rally. Interestingly, a comparison of skew positioning relative to Jul 23 shows similar demand for downside puts but a notable decline in the demand for upside calls resulting in a comparably steeper negative S&P skew gradient now vs then. See pg 5.
Cross-Asset Volatility Monitor
Cross-Asset Volatility Snapshot (10Y Lookback)
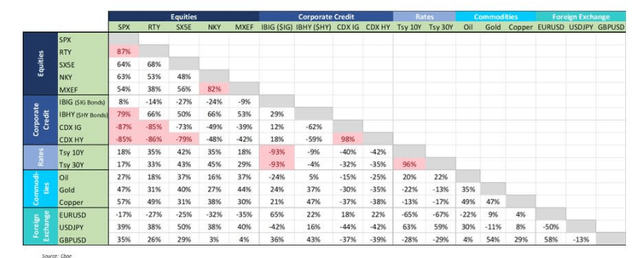
Cross-Asset Correlation Matrix
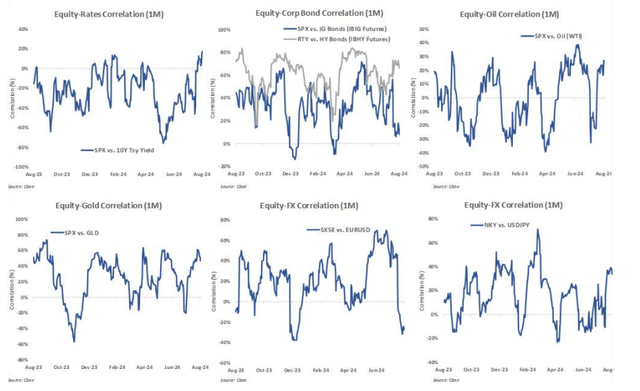
Cross-Asset Correlation Analysis
Macro Equity Volatility
VIX Index Volatility
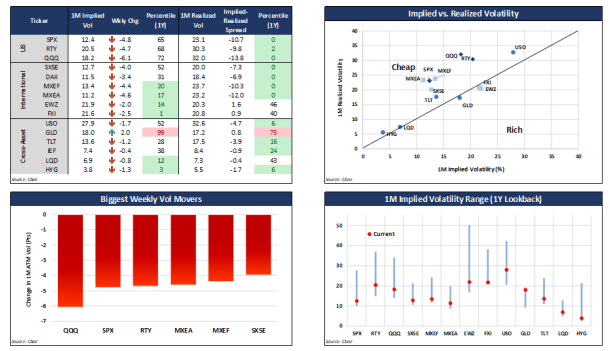
US Index Volatility
Disclaimers:
The information provided is for general education and information purposes only. No statement provided should be construed as a recommendation to buy or sell a security, future, financial instrument, investment fund, or other investment product (collectively, a “financial product”), or to provide investment advice.
In particular, the inclusion of a security or other instrument within an index is not a recommendation to buy, sell, or hold that security or any other instrument, nor should it be considered investment advice.
Past performance of an index or financial product is not indicative of future results.
The views expressed herein are those of the author and do not necessarily reflect the views of Cboe Global Markets, Inc. or any of its affiliates.
There are important risks associated with transacting in any of the Cboe Company products or any digital assets discussed here. Before engaging in any transactions in those products or digital assets, it is important for market participants to carefully review the disclosures and disclaimers contained at: https://www.cboe.com/us_disclaimers/
These products and digital assets are complex and are suitable only for sophisticated market participants. In certain jurisdictions, including the United Kingdom, Cboe Digital products are only permitted for investment professionals, certified sophisticated investors, or high net worth corporations and associations.
These products involve the risk of loss, which can be substantial and, depending on the type of product, can exceed the amount of money deposited in establishing the position.
Market participants should put at risk only funds that they can afford to lose without affecting their lifestyle.
© 2024 Cboe Exchange, Inc. All Rights Reserved.
Original Post
Editor’s Note: The summary bullets for this article were chosen by Seeking Alpha editors.
Read the full article here

 Q3 2024 Earnings Call Transcript")

")
")

")
