


")


Introduction
If you’re an income investor or retiree, there’s a high likelihood that Business Development Companies make up a sizable portion of your portfolio. As an income investor myself, but not yet near the traditional retirement age, these are staples in my portfolio as I plan to live off dividend income in the next 5-10 years.
Although their dividends are what mostly attracts investors, there’s an additional metric that is very important as well, net asset value, or NAV. In this article, I discuss the importance of NAV growth over time and how this could affect shareholder returns over the long term.
What Makes BDCs Attractive?
When talking to former co-workers or family, I often am surprised that many of them have never heard of Business Development Companies. When they ask, I simply say, “Look at them as banks for smaller, sometimes financially distressed companies.”
Due to rules they must follow, BDCs, like Real Estate Investment Trusts, must pay out 90% of their distributable income in the form of dividends. So, in short, they retain little cash to reinvest, unlike traditional dividend paying companies: Apple (AAPL) or Costco (COST).
This is the reason why many have higher dividend yields, upwards of 10% or more at times. Moreover, they also benefit greatly from higher interest rates, which has resulted in increased dividends and/or special dividends over the past 2 1/2 years. But aside from collecting a reliable income, their net asset value is just as, if not more, important. Why? I’m glad you asked.
Why NAV Growth Is So Important
Net investment income is what BDCs use to cover the dividends. And usually as investors, we like to see this grow over time. But I would say a BDC’s NAV growth is just as important.
This is because those with higher NAV growth over time have experienced superior returns in comparison to their peers. In the chart below, I compare several BDCs whose NAVs declined over the past 2 to 2 1/2 years. The reason I use this time period is because this is when the FED decided to hike interest rates, back in March 2022.
Author chart creation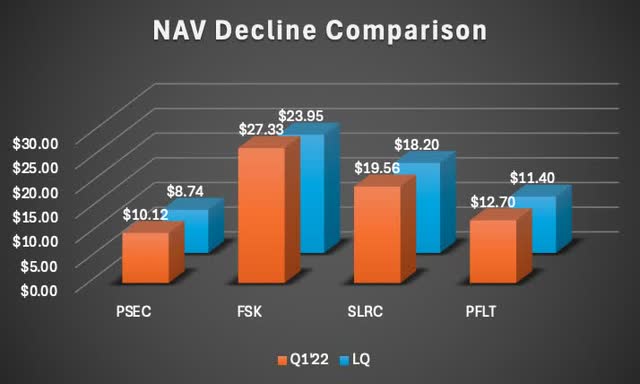
Above you can see Prospect Capital Corp. (PSEC) saw the largest NAV decline at 13.63% followed by FSK KKR Capital (FSK) at 12.36%. PennantPark Floating Rate Capital (PFLT) and SLR Investment Corp. (SLRC) saw the smallest declines at 10.23% and 6.95% respectively.
Here we take a look at their share price performance compared to the S&P 500 from then until now. All four BDCs are in the red compared to the index, up 25.5%.
Seeking Alpha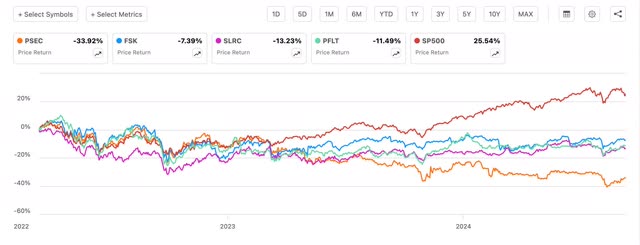
Here’s how they fare in terms of total returns compared to the S&P. All fare much better as a result of their high dividends, with the exception of Prospect Capital Corp who is the only one in the red, down nearly 13%.
Seeking Alpha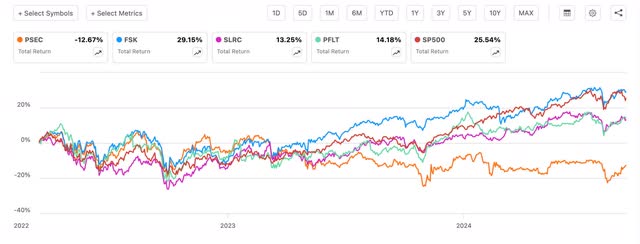
Now, we compare BDCs who saw NAV growth over the same period.
Author chart creation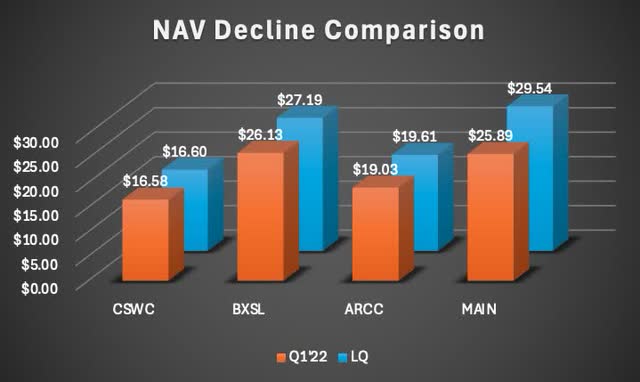
Capital Southwest (CSWC) saw minimal NAV growth at less than 1% while Main Street Capital (MAIN) saw the highest at 14.10%. Blackstone Secured Lending (BXSL) and Ares Capital (ARCC) both saw growth of 4.06% and 3.05% respectively.
Here’s how they fared in price returns compared to the S&P. As you can see, all four are in the green in comparison to their peers, whose NAVs declined the past 2 1/2 years. The BDC who experienced the highest NAV growth, Main Street Capital, led the pack, up 19.05%.
Seeking Alpha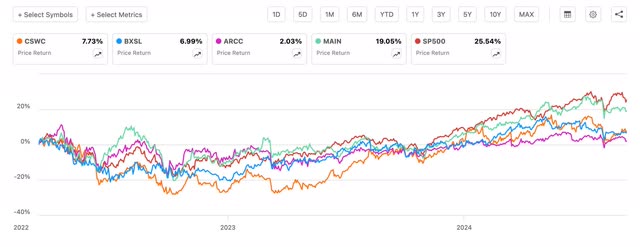
Here’s how they did in total returns vs the S&P over the past 2 1/2 years. Again, Main Street Capital currently leads the pack, up 46.63%, even besting the S&P.
Seeking Alpha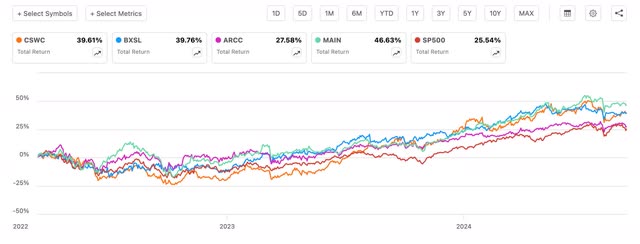
NAV Impact
There are several factors that could impact a BDC’s NAV. For instance, metrics like out-earning the dividend, dividend payments, unrealized losses, and share issuance, etc. are all things that could negatively impact net asset value.
That’s why their NAVs may experience a decline over a short time period. For example, Capital Southwest, one of the top performing BDCs, saw a NAV decline of roughly 1% during their latest quarter. But over the longer term, their NAV grew, albeit slightly.
This declined quarter-over-quarter as a result of unrealized depreciation of their portfolio as well as dilution from issuing shares of restricted stock to their employees. This could be accretive if management teams issue shares above NAV, which is what shareholders should look for when investing in the sector.
But over time, NAV growth is something you should concern yourself with. If a company has seen this decline over a longer period of time, you have to ask yourself: Are they a good investment long term?
Of course, dividends are important, but NAV erosion is not a metric you want to see from an investment.
Author chart creation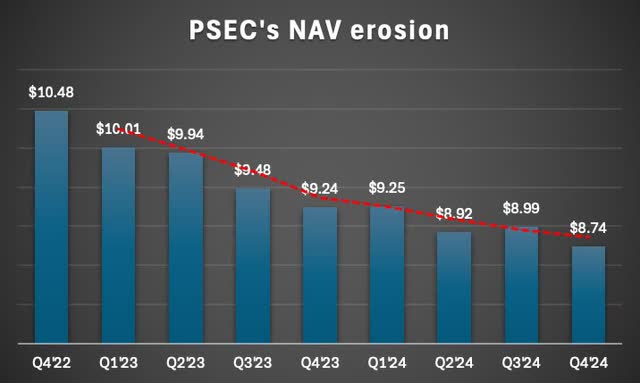
For example, in the chart above you can see since Q4’22 Prospect Capital Corp’s NAV has seen a consistent decline over the past 2 years with the exception of Q1 & Q3’24 where they saw a slight increase.
But over the long term, their NAV has eroded. And as previously mentioned, this was reflected in their negative price and total returns. So, although they have consistently paid a steady dividend since then, they have significantly underperformed their peers.
Investor Takeaway
Every investor has different metrics when analyzing stocks or companies that they may deem more important. This article was written to inform readers of the impact that net asset value growth can have on your investment over time.
In my opinion, this is probably the most important metric aside from the dividend. Strong NAV growth can often lead to outperformance in both share price and total returns, as demonstrated by Main Street Capital.
As a company’s net asset value continues to grow, the more likely their portfolio will continue along the same path or vice versa. Business Development Companies aren’t known for their growth, but mainly for their high yields and dividend income.
Moreover, those who experience strong NAV growth will likely reward shareholders with superior returns over the long term. Aside from higher than typical dividend yields, which makes BDCs highly attractive, investors should do their due diligence on assessing one’s net asset value growth over a longer period of time.
Read the full article here

")
")

")
")
