
")


“The two most powerful warriors are patience and time. “- Leo Tolstoy
Broader Participation
Almost any asset class owned by investors rewarded them with a positive return in the third quarter. The market saw broader participation from stocks other than the so-called Magnificent 7 stocks. In our last newsletter, we noted more than of the S&P 500 Index’s (SP500, SPX) first half return was generated by just four of the Magnificent 7 stocks. In the second half though, beginning June 30, the Mag 7 account for just 2.9 percent of the S&P 500 Index return, with the remaining 493 stocks contributing 97 percent of the return. Further evidence of broader stock participation is seen in the third quarter return in the various asset classes.
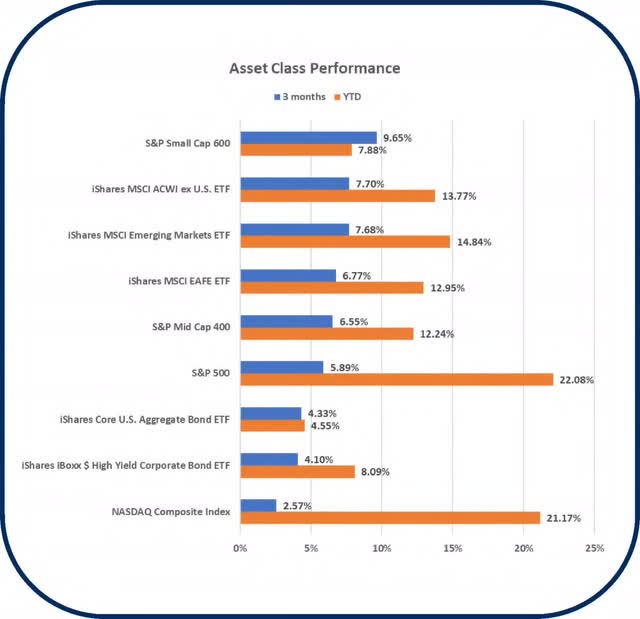
For the third quarter, one of the best returning asset classes was the S&P 600 SmallCap Index, followed by broad international stocks, including emerging markets and then the S&P 500 Index. Other equity styles outperformed the S&P 500 Index too, with the S&P 500 Dividend Aristocrats Index up low double digits in the third quarter. This broader stock participation is healthy for the market and generally is supportive of further gains in the equity market.
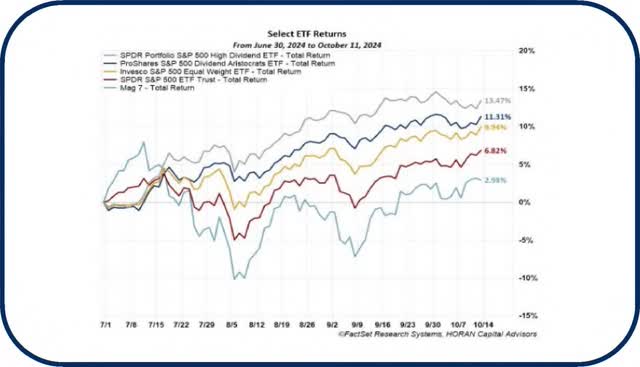
For the U.S. market, this broader participation away from just the Magnificent 7 stocks is seen in the chart on the prior page where the top two performing ETF’s are dividend focused strategies.
Even bond investors enjoyed favorable returns, partly generated in anticipation of the recent Federal Reserve interest rate cut. The S&P U.S. Aggregate Bond Index was up about 5.0% in Q3 and the S&P U.S. Treasury Bond Index was up 4.5%. The strong quarterly bond returns erased the negative returns generated by bonds in the first half of the year.
A Focus on the Fed
At the September meeting for the Federal Open Market Committee (FOMC) the Fed announced the beginning of a Fed Rate cutting cycle. The committee elected to lower the Federal Funds Rate by half a percent, lowering the upper bound rate to 5%. Additionally, the Dot Plot, which is a survey of the FOMC sitting member’s future rate expectations, is projecting the median rate to be at 3.4% by the end of 2025. With this expectation comes certain assumptions around inflation and unemployment. For instance, the median expected value for 2025’s Personal Consumption Expenditures (PCE), the Fed’s favored inflation measure, is an inflation target of 2%. Meanwhile the Fed expects real GDP to run at 2% and unemployment to not peak over 4.5%. These expectations would be consistent with a soft-landing, cooling inflation, a growing economy, and an unemployment rate below the historical median.
The Fed has a dual mandate as it implements monetary policy changes. The mandate is to pursue policies that sustain favorable economic conditions that achieve both stable prices and maximum sustainable employment. As noted earlier, inflation appears to be coming in closer to the Fed’s target of 2%. Regarding employment, the nonfarm payroll report on October 4, 2024 widely exceeded expectations by increasing 254,000 in September versus expectations of 145,000. The unemployment rate fell .1% to 4.1% and average hourly earnings rose .4%, up 4.0% on a year-over-year basis. This was the largest increase in jobs in the last six months and is evidence of a fairly strong economy. With these reports some strategists suggest the Federal Reserve does not need to initiate additional large interest rate cuts; hence, a soft landing may be the base case outcome. With this apparent economic strength, future rate cut expectations for the fed funds rate are a 25 basis point cut at the November meeting and another 25 basis point cut at the December meeting.
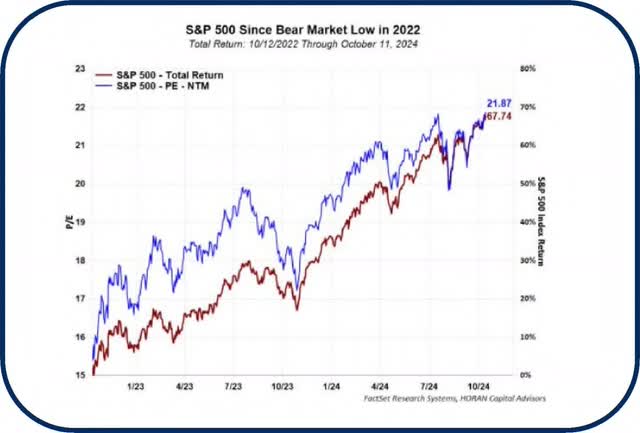
2-Year Anniversary of Bull Market
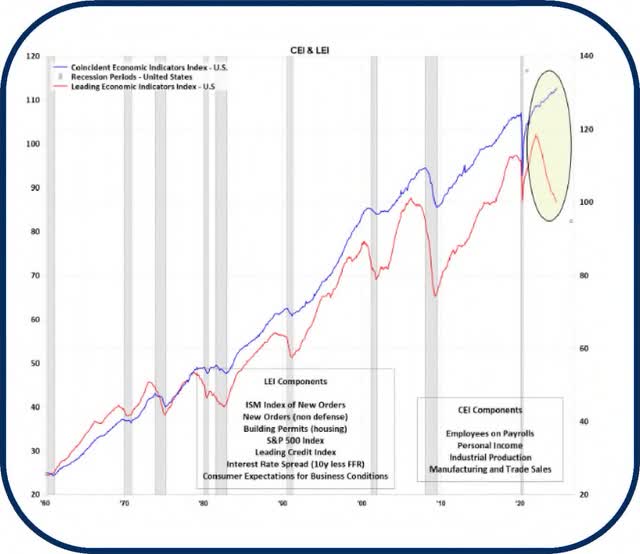
The current bull market has reached its 2-year anniversary in an environment influenced by skepticism. It is this type of environment where the equity market tends to climb the proverbial “wall of worry.” Much of the economic data has been mixed as is partially evident by the Conference Board’s Leading and Coincident Economic Indicators. The Index of the Coincident Indicators continues to trend higher while the Index of Leading Indicators (LEI) has been in a downtrend since early 2022. The LEI’s weakness in the August report was led by a weaker trend in new orders. The grey shaded areas on the chart are prior recession and the LEI has weakened prior to recessions. However, the CEI has not followed suit.
Business Sentiment
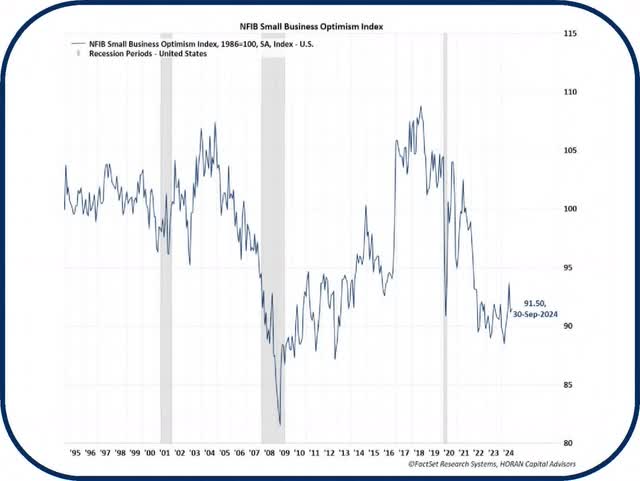
Small businesses, an important driver of economic activity, are seeing their owners express a low level of optimism. The National Federation of Independent Business (NFIB), an association of small businesses, is reporting the Small Business Optimism Index was reported at 91.5 in September, the 33 rd month in a row reported below the 50-year average of 98. The NFIB report notes,”Of the 10 Index components, five increased, three decreased and two were unchanged.” The area that small business owners cited as the single most important problem facing their business was inflation, cited by 23% of those responding to the survey. Despite the mixed economic data and weak optimism among small business owners, corporate earnings continue to be strong. Argus Research is reporting the just started third quarter earnings reporting season may show the strongest annual earnings per share growth in ten quarters.
Back to the equity market, Sam Stovall, CFRA Chief Investment Strategist, noted in a report that ended just prior to the 2-year bull market anniversary,
“During the first year of the succeeding bull market, the S&P 500 gained 22%. During the soon-to-be concluded second year, through October 10, 2024, the “500” rose an additional 33%, recouping 152% of what was lost in the prior bear market. Encouragingly, all 14 bull markets since 1947 recorded an average bear market recovery of 375%, implying, but not guaranteeing, that this bull market has much further to run.”
As stated in prior newsletters, bull market advances do not occur in a straight line. Market pullbacks and volatility are a normal part of investing in stocks. Also, noted in Stovall’s recent commentary was the fact the equity market is trading at an elevated valuation level, or elevated price to earnings ratio (P/E). This higher valuation level has some support centered on the fact corporate earnings growth is strong and in fact expectations are for growth to accelerate from 2024 to 2025 as seen in the near table. Also supportive of higher valuations is centered around actions by the Federal Reserve in terms of lowering interest rates. Importantly though, as rates are lowered, inflation needs to remain in check. Lower rates and lower inflation enable stocks to trade at higher valuations as future earnings for companies are worth more in today’s dollars.
S&P 500 Y/Y Growth Rates
Source: LSEG VB/E/S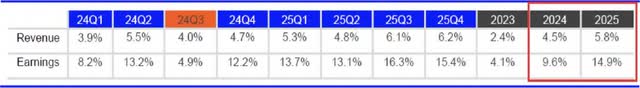
No Recession?
Third quarter news and asset returns could be described by one word: confirmation. Investors this quarter have begun to recognize the resiliency of the US economy as evidenced by a broadening out in the bottom 497 S&P constituents and small cap returns. Additionally, the Fed seems to confirm this economic strength through their projections about future unemployment and real GDP growth. Finally, the continued overall run in the S&P 500 and upward revisions in future earnings also serves as confirmation that the economy may have shaken the recession calls made by some strategist in 2022.
Thank you for your continued confidence and support in HORAN Capital Advisors and we are always available to answer your questions and discuss our outlook further. Please be sure to visit us for company news, reports, and our blog at https://horanwealth.com/insights.
Respectfully,
HORAN Capital Advisors
|
HORAN Capital Advisors, LLC is an SEC Registered Investment Advisor. The information herein has been obtained from sources believed to be reliable, but we cannot assure its accuracy or completeness. Neither the information nor any opinion expressed constitutes a solicitation for the purchase or sale of any security. Any reference to past performance is not to be implied or construed as a guarantee of future results. Market conditions can vary widely over time and there is always the potential of losing money when investing in securities. HCA and its affiliates do not provide tax, legal or accounting advice. This material has been prepared for informational purposes only, and is not intended to provide, and should not be relied on for tax, legal or accounting advice. You should consult your own tax, legal and accounting advisors before engaging in any transaction. For further information about HORAN Capital Advisors, LLC, please see our Client Relationship Summary at adviserinfo. sec. gov/firm/summary/152888. |
Original Post
Editor’s Note: The summary bullets for this article were chosen by Seeking Alpha editors.
Read the full article here
")
")

")

