Lean, efficient operations are the cornerstone of REIT outperformance, yet the topic receives surprisingly little focus. The spread in operating efficiency between a lean REIT and a bloated REIT is substantial to the tune of 2000+ basis points of revenue, which can drastically alter how much of the property income makes it through to shareholders.
In this article, we examine all 175 equity REITs to determine which have efficient operations and which might be keeping a bit too much of the juice for themselves. Once we discuss the methodology of determination, we will reveal the most and least efficiently run REITs.
Efficiency metrics
Conceptually, efficiency is quite straightforward: The less a REIT spends on corporate overhead, the more of its operating income passes through to the bottom line.
It is a bit more complicated to actually measure with any degree of accuracy. Perhaps the best starting metric for measurement is G&A as a percentage of revenue. Lower is of course better. Here are the REITs with the lowest G&A as a percentage of revenue.
Portfolio Income Solutions
This is far from the actual list of most efficient REITs as there are multiple distortions making the data appear as it does.
- Externally managed skew
- Size skew
- Property type skew
- Nature of returns skew
- Leverage skew
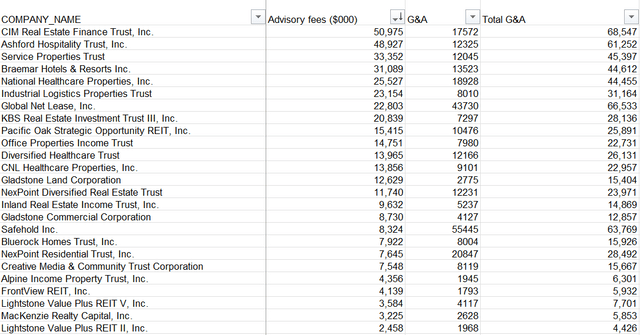
The easiest distortion to correct for is external management. One may notice that the above list of lowest G&A REITs has quite a few externally managed REITs and the reason for this is simple; advisory fees are not included in the G&A figure. So, we correct for it by adding advisory fees to reported G&A to obtain a figure we call “Total G&A”.
Portfolio Income Solutions
From here on, we will be using total G&A as the corporate overhead figure to measure against revenue, NOI and other income metrics.
We can understand the other data distortions a bit better once we examine REIT operating cost efficiency at a full sector level.
- Median total G&A as a percentage of revenue: 8.49%
- Mean total G&A as a percentage of revenue: 11.27%
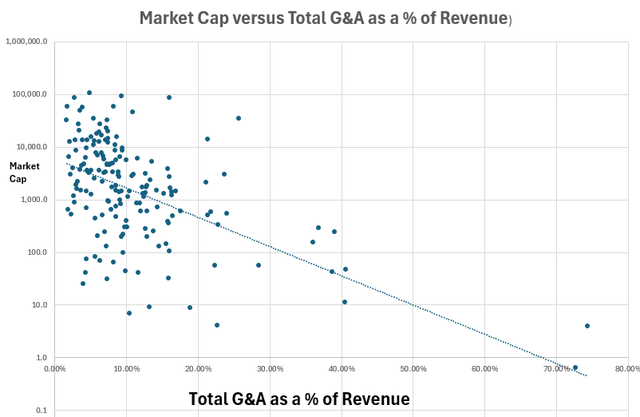
Below, we have plotted total G&A of each REIT as a percentage of revenue on the X axis against market cap on the Y axis.
Portfolio Income Solutions
Note that there is a fairly strong correlation between larger market caps and lower G&A as a percentage of revenue.
This makes sense because corporate overhead consists of both fixed costs and variable costs. While the variable costs scale with the size of the company, there are certain costs such as regulation and compliance which are largely flat regardless of how large or small a company is. The compliance costs of being listed on a public exchange alone are often over $1 million a year, which is why many of the very small REITs choose to list on the Toronto Stock Exchange instead of the NYSE since its overhead is lower.
These fixed costs guide toward a minimum viable size. Any REIT under $300 million in assets will be severely hampered by overhead, and anything under $1B is disadvantaged from an efficiency standpoint.
So while there is a size distortion in that larger companies will tend to score better on G&A efficiency metrics, it is not a distortion we need to correct for. The larger companies are legitimately more efficient on average.
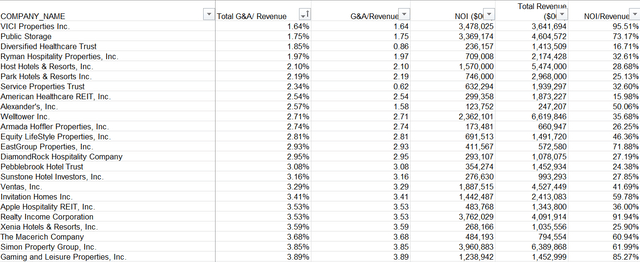
Here are the REITs with the lowest Total G&A (inclusive of advisory fees) relative to revenue:
Portfolio Income Solutions
This still isn’t quite accurate because there are remaining skews to correct for. Notice on the list above that there are quite a few hotel REITs. This is due to property type skew.
Real estate is priced using a cap rate on Net Operating Income [NOI] and not really priced on its revenue. Hotels are a high revenue and high expense asset class, meaning that $1B worth of hotels will have about 4X as much revenue as $1B of triple net leased retail despite having similar NOI.
The difference is in NOI margin. Ryman Hospitality (RHP), Host Hotels (HST) and Park Hotels (PK) come in at 4th, 5th, and 6th for lowest G&A relative to revenue, but these companies have 32%, 28% and 25% NOI margins respectively.
In contrast, industrial REIT EastGroup Properties (EGP) has a 72% NOI margin, so while EGP’s total G&A as a percent of revenue is slightly higher at 2.93% compared to the hotel REITs at about 2%, EGP has significantly lower G&A relative to its NOI.
Since most real estate trades at NOI cap rates between 4.5% and 9%, higher NOI margin asset classes are quite often going to be lower revenue asset classes. Thus, the G&A efficiency relative to revenue needs to be adjusted for margins.
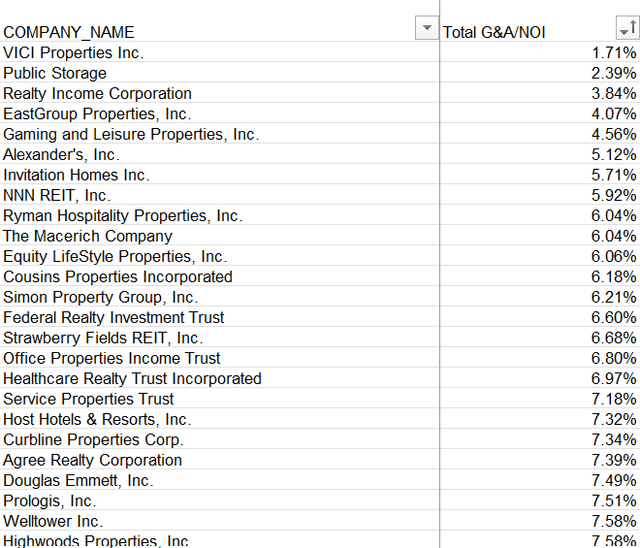
Below are the most efficient REITs on total G&A relative to NOI.
Portfolio Income Solutions
Another aspect to correct for is SG&A which is often included in reported G&A.
SG&A is essentially the cost of sales and is an essential part of doing business in certain industries. REIT subsectors with particularly high SG&A are data centers and advertising.
Iron Mountain (IRM) Digital Realty (DLR), Equinix (EQIX), Lamar Advertising (LAMR) and OUTFRONT Media (OUT) all score terribly on Total G&A versus both revenue and NOI.
These companies are not particularly inefficient, sales expenses are just a part of how their businesses operate.
Nature of returns skew
Just as SG&A skews the expense line item, certain asset classes don’t get full credit for their income. Farmland and Timberland get a significant portion of their returns through land appreciation. Due to the way REIT accounting works, land appreciation does not flow through revenue or NOI. As such, farmland and timberland are going to have artificially elevated G&A ratios because their revenue and NOI lines are only capturing about 40% and 60% of their earnings, respectively (rough numbers).
This goes a little outside the scope of REITs, but since REITs are starting to own some power generation related assets, it is worth covering. Most power generation asset classes will need to be adjusted in the opposite way as farmland and timberland since rather than appreciating, these asset classes are depleted.
- An oilfield eventually runs out of accessible oil
- A solar panel or wind turbine eventually needs to be replaced.
Thus, one should adjust the cashflows of these asset classes by their depreciation schedule. If depletion takes 33 years, their actual earnings are 3 percentage points lower than their cashflow (rough numbers again).
So, on the raw G&A versus revenue or NOI screen land assets are going to look inefficient and power assets are going to look efficient. After making the proper adjustments, both asset classes fall much closer to the norm.
With all of these adjustments in mind, we shall discuss the most and least efficiently run REITs:
The #1 Least Efficient REIT: Ashford Hospitality (AHT)
Despite looking good on the initial screening with G&A to revenue of 0.86%, AHT has negative adjustments across every category.
- Tiny size – $41 million market cap
- Hotel assets with high revenue relative to NOI
- High leverage, further amplifying revenues relative to true earnings
- High advisory fees – $48.9 million in the most recent year
It is astounding that advisory fees paid to its external manager are more than 100% of the market cap of the company. With overhead of this magnitude, it will be quite difficult for shareholders to get a good return. We have been warnings about the dangers of AHT for a long time and unfortunately the future doesn’t look any brighter.
#2 Least Efficient REIT: Subscale Microcaps
There are a few REITs that are just too small to be viable from an operating efficiency standpoint
- Generation Income Properties – Total G&A 52.7% of NOI
- Presidio (SQFT) Total G&A 63% of NOI
- Modiv (MDV) Total G&A 42.6% of NOI
This inefficiency is obviously quite extreme, considering the median total G&A is 14.5% of NOI. Note, that inefficiency does not inherently make these uninvestable. At deep enough discounts, there could be a case for merger related upside. These companies could be bought out by larger peers which would eliminate the duplicated G&A expense, thereby making it a highly accretive acquisition while still providing existing shareholders substantial upside.
I am not saying these particular REITs are necessarily likely M&A targets, rather that something along those lines would be a more likely buy thesis than these as stand-alone entities given how inefficient their subscale makes them.
Least Efficient REIT #3: Sun Communities (SUI)
SUI has Total G&A at 18.89% of NOI, which is extremely high for a company of its size at a market cap of $15.7B.
The expense is not related to its industry, as both of its manufactured housing peers run at much cheaper expense ratios. Even UMH runs more efficiently despite being much smaller at $1.5B market cap.
SUI’s inefficiency stems from what I view as excessive management compensation. CEO Gary Shiffman made $24 million and $22 million in 2021 and 2022 which got reduced to a still high $12.5 million in 2023.

S&P Global Market Intelligence
He also has a $36 million golden parachute if the company were to get bought out, which might be large enough to deter M&A.
Careful measurement of company operational efficiency is a key part of our due diligence at Portfolio Income Solutions, where we have uploaded the full G&A efficiency dataset.
REIT properties tend to throw off quite a bit of cashflow, but a big differentiator between REITs that outperform and those that struggle is how much of that cashflow is spent or wasted before making it through to shareholders. We much prefer to invest in efficiently managed REITs with the top 3 discussed below:
#3 most Efficiently Managed REIT: East Group Properties
Most of the REITs scoring at the low end of total G&A as a percentage of NOI are very large, but EGP manages to have total G&A be only 4.07% of NOI despite being a mid-cap REIT at $8.5B.
I have consistently been with EGP’s management team on conference calls and chatting with them at the 2024 REITWEEK conference. They do a good, honest job and have really positioned EGP well for long-term growth. The main downside here is that EGP’s stock is still somewhat expensive on an AFFO multiple basis. Given the merits of the company, we will be watching for any dip on which to buy.
#2 most Efficiently managed REIT: Public Storage (PSA)
I don’t think anyone will be surprised to see PSA listed here. Efficiency is core to how the company is run, and they are one of very few REITs that directly discuss G&A efficiency on conference calls.
PSA’s revenue flows quite nicely through to investors with high NOI margins at 73% of revenue. Total G&A is just 2.39% of NOI.
While efficiency is a big deal, a REIT still needs strong fundamentals to perform well and self-storage fundamentals are just about the worst of the 20 REIT property types. The sector is already oversupplied with more deliveries in the pipeline.
PSA isn’t wasting any money, but same store NOI outlook is rough in my opinion.
#1 most Efficiently Manage REIT: VICI Properties (VICI)
VICI’s efficiency metrics are impressive across the board.
- Lowest G&A as a percent of revenue of any REIT – 1.67%
- Lowest G&A as a percent of NOI of any REIT – 1.73%
- 94% NOI margins
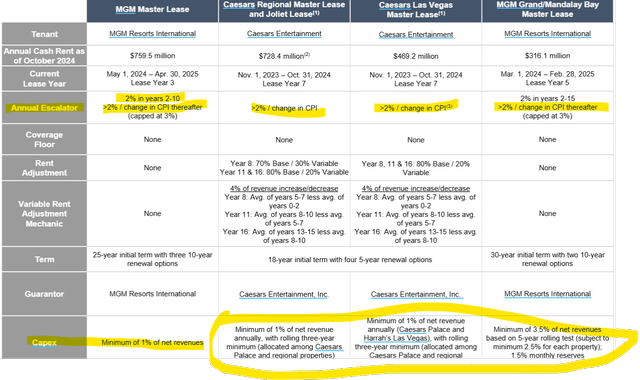
VICI’s efficiency goes beyond corporate overhead. It has among the best lease structures of any triple net REIT.
Most triple net leases are structured where the tenant pays insurance taxes and general maintenance, which makes the rent paid to the REIT closer to true NOI. We generally like triple net leases for this reason.
VICI’s leases contain 2 additional clauses:
- Tenants must pay a pre-specified amount for property upgrades
- Leases contain rent escalators
With leases structured in this way, VICI’s properties are positioned to stay in great condition while the REIT gets to organically increase its cashflows over time. These terms are highlighted below.
VICI
Escalators are fairly normal among triple net REITs, but made stronger when combined with VICI’s 20+ year terms.
Wrapping it up
Efficient operations are one of many factors to consider when investing in REITs. The subtleties of these metrics are often overlooked by the market which can create pockets of mispricing and opportunity.
Editor’s Note: This article covers one or more microcap stocks. Please be aware of the risks associated with these stocks.
Read the full article here


