


")


It’s called the business cycle because things are always changing.
In February of 2020, COVID brought world economies to their knees with an effective cessation of life as we knew it. Non-essential offices and workplaces shut down. Stores, restaurants, and entertainment venues closed as personal contact became untenable. E-commerce surged and to combat supply chain bottlenecks, retailers and manufacturers leased more warehouse space. The COVID era’s low-interest rate environment enabled developers to meet new industrial demand by ramping up new warehouse construction.
4 ½ years later, we are coming off an unprecedentedly steep, inflation-fighting series of hikes to the Fed Funds rate. New construction has slowed to a trickle and demand may be waning. A few weeks back, Home Depot (HD) announced its intention to sublease almost 4.7 million square feet of warehouse space it leased during the pandemic. A Savills report, summarized by Yahoo Finance and The Real Deal, describes that industrial vacancy has hit a 10-year high, exacerbated by the growing amount of sublease space available.
In recent years, industrial/logistics real estate had arguably become the most desirable property type. Lately, not so much. In this Sector Spotlight we will examine, in the realm of industrial REIT investment, where we have been, where we are now, and where we might be headed. We compare market valuations relative to AFFO/share, Net Asset Value (NAV), and 3Q24 Same-Store Net Operating Income (SSNOI).
2024 Returns
3Q 2024 Industrial REIT earnings reports were largely positive with sustained strong occupancy and re-leasing roll-ups. Investors, however, seemed unimpressed and share price performance ranged from slightly negative to blood-in-the-streets.
Industrial REITs: 2024 Total Returns through 12/05/2024
S&P Capital IQ
Source: S&P Capital IQ as of 12/05/2024
Market Valuations
Various metrics can be applied to understand a company’s intrinsic value relative to its market valuation. At Portfolio Income Solutions we put significant trust in Adjusted Funds from Operations (AFFO/share) measures because they level the earnings playing field in a peer set. At present, the AFFO/share multiples of the Industrial REIT sector look like this.
2MCAC with data derived from S&P Capital IQ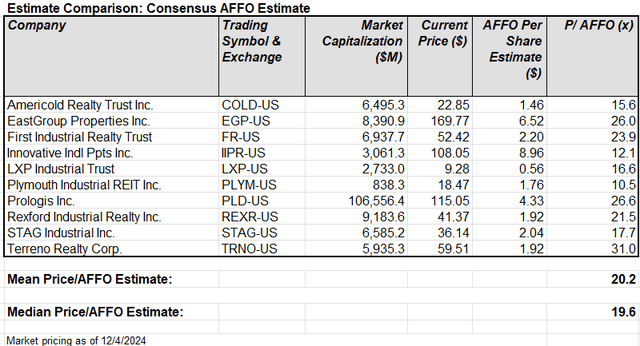
An average P/AFFO multiple of 20.2x prices the sector north of the whole REIT universe multiple of 17.5x, but the valuation variance within the set is extreme. Plymouth Industrial (PLYM) is trading at an AFFO multiple of approximately 1/3 that of Terreno Realty (TRNO). The market losses in the graph above are a reflection of how dramatically investor attitudes have changed in recent history and how that translates to trading multiples.
2MCAC with data derived from S&P Capital IQ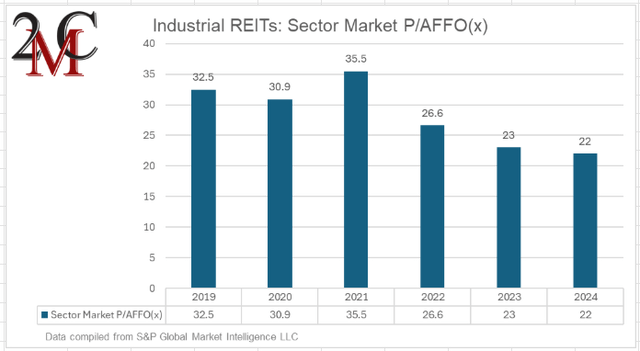
Source: 2MCAC
With the sector AFFO multiple falling from 35.5x in 2021 to a recent 20.5x, you can ascertain that investor enthusiasm for investment in industrial real estate has waned significantly. In an era of protracted Magnificent 7 outperformance, identification of industrial REITs as a prime source for tax-loss harvesting might also contribute to recent price declines.
Same-Store Net Operating Income
Third quarter reporting indicated that while the industrial and multifamily sectors are still seeing strong demand, waves of competing new supply have suppressed both rent growth and occupancy. The result is a trend of more tepid SSNOI growth for those sectors. On average, the industrial REIT sector saw same store cash NOI grow 5.9% compared to 3Q23. That’s strong income growth but pales next to the double-digit growth investors paid 35x AFFO just a couple of years prior. The future is unknown, but if growth slows further share prices might continue to fall.
2MCAC with data compiled from S&P Capital IQ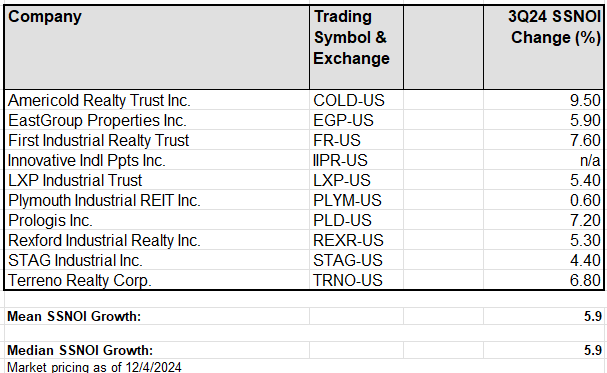
Net Asset Value
NAV is broadly considered a useful metric for comparison of value relative to market share price and to peers. Twelve months ago, equity REITs traded at a high teens discount to Net Asset Value. Today they trade at close to NAV valuations, but the industrial sector demonstrates extreme variance in market value to estimated intrinsic value. In prior periods the premiere performers like PLD, REXR, and TRNO traded at premiums to NAV, but market valuations have come back to earth.
2MCAC with data compiled from S&P Capital IQ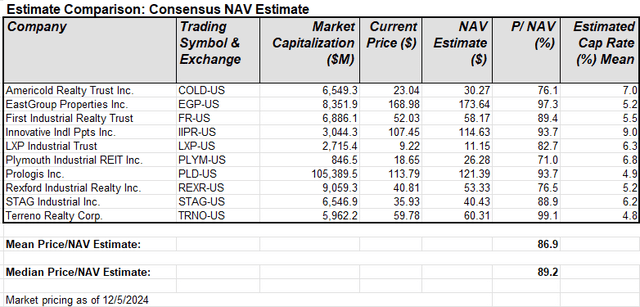
Source: 2MCAC with data compiled from S&P Capital IQ
When considering NAVs, it is important to understand that the value is derived from using an assumed capitalization rate. As the table above describes, the applied Cap Rates vary widely. In this case from 4.8% up to 9.0%; the lower the cap rate applied, the higher the NAV derived. Operationally, these companies are extremely diverse, so that is why we see outlying cap rates for the cannabis focused Innovative Industrial Properties (IIPR) and the frozen food chain focused Americold Realty Trust (COLD).
Takeaways
E-commerce and related logistics play an ever-larger role in the US economy, and they have been the driving force in growing the industrial REIT sector. Changing macroeconomic factors have made visible the vulnerability of all types of real estate to supply and demand and made investors painfully aware that trends don’t run on forever.
The industrial REIT sector has price corrected significantly (and appropriately) in the last two years. We feel that current pricing makes the sector much more investible and that if shares are being further beaten down by tax-loss selling, then a sustaining strong economy makes them opportunistically priced.
Happy investing.
Read the full article here
")
 | Seeking Alpha")
")


")
")