Curb Your Enthusiasm
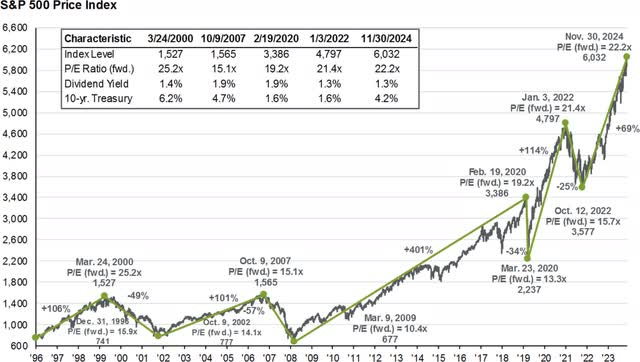
Source: J.P. Morgan Asset Management
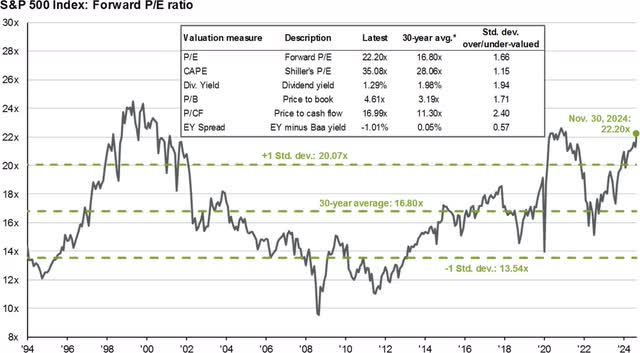
Source: J.P. Morgan Asset Management
Review and Outlook
|
4Q |
YTD |
1-Year |
3-Year |
5-Year |
|
|
Wedgewood Composite Net |
5.5 |
29.1 |
29.1 |
7.6 |
16.8 |
|
Standard & Poor’s 500 Index |
2.4 |
25.0 |
25.0 |
8.9 |
14.5 |
|
Russell 1000 Growth Index |
7.1 |
33.4 |
33.4 |
10.5 |
19.0 |
|
Russell 1000 Value Index |
-2.0 |
14.4 |
14.4 |
5.6 |
8.7 |
|
10-Year |
15-Year |
20-Year |
25-Year |
30-Year |
|
|
Wedgewood Composite Net |
12.5 |
13.6 |
10.9 |
8.8 |
13.2 |
|
Standard & Poor’s 500 Index |
13.1 |
13.9 |
10.4 |
7.7 |
10.9 |
|
Russell 1000 Growth Index |
16.8 |
16.5 |
12.6 |
7.8 |
11.6 |
|
Russell 1000 Value Index |
8.5 |
10.8 |
7.9 |
7.4 |
9.8 1 |
Manager vs Universe:Gain to Loss Ratio (As of September 2024)

|
1 YEAR |
3 YEARS |
5 YEARS |
10 YEARS |
15 YEARS |
20 YEARS |
25 YEARS |
30 YEARS |
|
|
Median |
1.40 |
1.07 |
1.05 |
1.00 |
1.05 |
0.97 |
0.97 |
1.00 |
|
Focused Large Cap Growth Wedgewood Full |
1.69 |
1.08 |
1.15 |
1.18 |
1.25 |
1.19 |
1.13 |
1.29 |
|
Russell 1000 Growth |
1.99 |
0.99 |
1.14 |
1.10 |
1.18 |
1.13 |
1.03 |
1.02 |
|
S&P 500 (SP500, SPX) |
1.24 |
0.93 |
0.95 |
0.83 |
0.90 |
0.81 |
0.82 |
0.86 |
|
Valid Count |
769.00 |
763.00 |
726.00 |
635.00 |
516.00 |
387.00 |
240.00 |
133.00 |
|
Source: PSN Large Cap Manager Database. Data calculated for managers on gross-of-fee returns. See net-of-fees above. Past performance is noguarantee of future results. Future results may differ materially from past results. Please see additional disclosures p. 29. 1 Portfolio returns and contribution figures are calculated net of fees. Contribution to return calculations are preliminary. The holdings identified do not represent all of the securities purchased, sold, or recommended. Returns are presented net of fees and include the reinvestment of all income. “Net (actual)” returns are calculated using actual management fees and are reduced by all fees and transaction costs incurred. Past performance does not guarantee future results. Additional calculation information is available upon request. |
|
Q4 Top Contributors |
Avg. Wgt. |
Contribution to Return |
|
Texas Pacific Land (TPL) |
1.65 |
1.60 |
|
Taiwan Semiconductor Manufacturing (TSM) |
8.38 |
1.16 |
|
Alphabet (GOOG,GOOGL) |
7.88 |
1.07 |
|
Visa (V) |
6.96 |
1.02 |
|
Booking Holdings (BKNG) |
5.12 |
0.86 |
|
Q4 Bottom Contributors |
||
|
CDW |
3.46 |
-0.97 |
|
UnitedHealth (UNH) |
6.22 |
-0.73 |
|
Tractor Supply Company (TSCO) |
5.12 |
-0.44 |
|
Old Dominion Freight Line (ODFL) |
2.23 |
-0.21 |
|
Pool Corp (POOL) |
2.21 |
-0.17 |
|
2024 Top Contributors |
Avg. Wgt. |
Contribution to Return |
|
Taiwan Semiconductor Manufacturing |
7.51 |
5.74 |
|
Meta Platforms (META) |
8.69 |
5.68 |
|
Alphabet |
7.74 |
2.62 |
|
Texas Pacific Land |
1.61 |
2.59 |
|
Motorola Solutions (MSI) |
5.38 |
2.55 |
|
2024 Bottom Contributors |
||
|
CDW |
4.46 |
-0.98 |
|
Pool Corp |
2.61 |
-0.32 |
|
Old Dominion Freight Line |
2.59 |
-0.20 |
|
Edwards Lifesciences (EW) |
4.44 |
0.16 |
|
UnitedHealth |
6.07 |
0.18 |
Top performance contributors for the fourth quarter include Texas Pacific Land, Taiwan Semiconductor Manufacturing, Alphabet, Visa and Booking Holdings. Top performance detractors for the fourth quarter include CDW, UnitedHealth, Tractor Supply Company, Old Dominion Freight Line and Pool Corp.
Top performance contributors for the year include Taiwan Semiconductor Manufacturing, Meta Platforms, Alphabet, Texas Pacific Land and Motorola Solutions. Top performance detractors for the year include CDW, Pool Corp, Old Dominion Freight Line, Edwards Lifesciences and UnitedHealth Group.
During the quarter we sold Texas Pacific Land.
Texas Pacific Land was a top contributor to performance during both the quarter and the year. Texas Pacific Land continues to be an extraordinarily unique and profitable business. The Company owns over 800,000 surface acres of land in the Texas Permian Basin. The vast majority of this land was acquired in the year 1888 and more recently (i.e. the last 15 years) this land became highly productive oil and gas royalty acreage thanks to modern drilling and completion techniques and technologies. Despite all of these deserved accolades, we liquidated our positions after the stock rallied quite sharply upon being consecutively added to two major stock indexes over the past seven months. The earnings power of the Company has not substantially changed over the past seven months (for better or worse). However, passive indexes and the traders and managers that closely follow and benchmark against those indexes effectively tripled their appraisal of the Company’s corporate value, while that value never changed. We will continue to monitor Texas Pacific Land from the sidelines and would hope to invest in them again, perhaps after the market’s “animal spirits” subside.
Taiwan Semiconductor Manufacturing was another top contributor to performance during the quarter and for the year. The Company’s earnings growth dramatically accelerated compared to last year as the Company’s wafer fabrication and packaging volumes soared in 2024. In addition, the Company customer prices rebounded in the face of more normalized capital expenditures. The Company maintains a near-monopoly in the fabrication of nearly every new AI accelerator brought to market over the past two years. They continue investing tens of billions to build and fill future capacity with orders for what seems to be insatiable hyperscale demand for accelerated computing. The stock ended the year trading at a consensus forward earnings multiple that is several points lower than large cap growth benchmarks, despite the Company’s dominant position in the most important industry that is driving one of the largest technological shifts in a generation.
Edwards Lifesciences was a contributor to quarterly performance but only slightly impacted annual portfolio performance. As we noted earlier this year, the Company’s flagship transcatheter aortic valve replacement (TAVR) franchise slowed as compared to the Company’s recent history. While the TAVR market is maturing, it is still far from saturated, as recent clinical trial results demonstrated. Many aortic stenosis patients prior to seeking TAVR treatment exhibit adverse symptoms, often prompting them to get the help of a doctor in the first place. However, there is a large population afflicted with aortic stenosis that do not exhibit symptoms which is monitored rather than treated with TAVR. Edwards presented data from its EARLY TAVR trial that showed 45 percent of untreated asymptomatic aortic stenosis exhibited no symptoms, still ended up dying, suffered a stroke, or were hospitalized for cardiac events compared to only 26 percent that had been treated with TAVR. The standard of care for a disease such as cancer is immediate intervention rather than waiting for symptoms to worsen. The EARLY trial could help position aortic stenosis treatment on a similar clinical footing as cancer treatment. Although this is just one study, it adds to the substantial body of knowledge that Edwards has created through its R&D investments, emphasizing how important their treatments are for patients. Edwards is well positioned for double-digit earnings growth over the next several years as they expand its structural heart franchise into new populations and indications.
O’Reilly Automotive modestly contributed to performance for the quarter and for the year. After a few years of outsized revenue and earnings growth, O’Reilly delivered more normalized sales and earnings growth in 2024 but continues to dominate in the highly fragmented automotive parts industry. As we have noted in the past, the Company has a mostly singular focus on the U.S. market, while several competitors have diverted their attention and investments away from the large and fragmented domestic market toward non-U.S. or nonautomotive markets. O’Reilly has taken profit share, particularly in the faster growing do-it-for-me (DIFM) end markets, by focusing both its hiring and capital expenditures on their U.S. stores and distribution infrastructure, while limiting acquisitions. We would consider adding to our positions in the future if short-term investors ever soured on shares due to protracted bouts of mild weather.
Tractor Supply Company detracted from performance during the quarter after reporting a slight decline in earnings on sales that were relatively 7lat. Tractor Supply Company continues to be a best-in-class retailer, focused on serving their niche customers that live in and maintain rural homes and homesteads, often with higher-than-average incomes. During the height of Covid-19 in the U.S., the Company grew substantially faster than its historical rates. Since then, and as consumer spending patterns have over-corrected back towards services, we have seen growth normalize. However, the Company continues to exhibit excellent returns on capital and retains ample addressable market to continue driving expected double-digit earnings growth through 2030.
CDW was a leading detractor from performance during the quarter and for the year. CDW is a distributor and reseller of technology solutions – including hardware, software, and services – primarily serving small businesses. A typical CDW customer has a few dozen employees and little if any dedicated IT professionals. This long tail of customers is difficult for large technology vendors to reach, making CDW an essential partner for many hardware and software service providers. Even though artificial intelligence is on the top of investors’ minds, many of CDW’s small business customers are still in the process of adopting basic IT solutions that are “old news” to most investors, such as cloud computing and digital security. As political winds in the U.S. shift toward supporting U.S. businesses, particularly through lower taxes, small businesses could benefit, which should help drive IT investments. CDW’s scale typically allows the Company to take share in small business IT spend, so we would expect any small business upturn to reaccelerate CDW’s growth profile.
Company Commentaries
Artificial Intelligence (‘AI’)
In our year-end Letter last year, we discussed our collective AI exposure in four of our holdings: Alphabet, Apple, Meta Platforms and Taiwan Semiconductor Manufacturing. This year we would like to continue to share our evolving thoughts on AI.
Why AI?
There have been triple-digit returns and trillions of dollars in market capitalization added to several publicly traded companies driven by surging demand for AI-specific hardware and software over the past few years. While Wall Street’s appreciation of these companies seems to go higher by the day, Main Street’s appreciation and understanding probably isn’t there yet. Imaginations are being used to fill in the yawning gap between what the market is implying and what AI can actually do for people today. Chatbots are sometimes fun to talk to but pretty boring to talk about. Most of the time, conversations about AI veer towards the fanciful, if not hackneyed, imaginary future of robots roaming the landscape.
There’s still the nagging suspicion that AI is a solution in search of a problem. Casual use of AI chatbots routinely returns incorrect information. Why are hundreds of billions of dollars chasing something that can’t count? ( https://community.openai.com/t/incorrect-count-of- r-characters-in-the-word-strawberry/829618) AI champions often counter that the wonders of AI can’t possibly be known at this point in time. As if every flaw in any AI’s output is probably a misunderstanding or laziness by the user and just a “hallucination” by the program. Errors sound better when they’re called hallucinations, as opposed to being labeled as “bullshit!” (Hicks, Michael Townsen, et al. “ChatGPT is Bullshit.” Ethics and Information Technology, vol. 26, no. 38, 2024, doi: 10.1007/s10676-024-09775-5).
Our view on AI is much less revolutionary or fanciful and more gradualist and incremental. AI didn’t fall out of a coconut tree in early 2023. It’s been hiding in plain sight. We have owned Alphabet for over 15 years and Meta Platforms over the past nearly seven years. Both companies are cloud-native and have been profitably serving billions of users on a daily basis for over a decade. Off-the-shelf hardware solutions for these companies is often not economically compatible with that kind of user demand. Instead, homegrown hardware and software solutions to solve company-specific problems have been customary for Meta and Alphabet. In order to serve their massive user bases, the Companies have been relying on machine learning. For example, Alphabet’s Google subsidiary released TensorFlow early in 2015 after spending years deploying a similar system across their properties. ( https:// www.bloomberg.com/news/articles/2015-10-26/google-turning-its-lucrative- web-search-over-to-ai-machines?embedded-checkout=true) During one of Alphabet’s 2015 earnings conference calls, a Wall Street analyst dutifully asked management to explain how “machine learning can make [Google Apps] more useful” as ML hadn’t really been discussed on calls before.
Maybe that question was not unlike today, as we ask, “Why AI?”
Yet we know from 2015 on, Alphabet would go to spend a cumulative $250 billion on research and development and $200 billion in capital expenditures for hardware and software to expand machine learning across its entire fleet, helping Alphabet generate almost $500 billion in gross cumulative cash flow. Alphabet’s Tensor Processing Units emerged as key hardware innovations that served the Company’s requirements for training and inference on the vast amounts of incoming data, where industry standard CPUs were not technically or economically as helpful.
Unlike Alphabet, Meta has relied more on GPUs provided by Nvidia to do much of its machine learning work, though the Company more recently began using proprietary ASICs. ( https://engineering.fb.com/2015/12/10/ml-applications/facebook-to-open- source-ai-hardware-design/). However, Meta was a pioneer in using these GPUs at scale, again, out of necessity for keeping up with the data its billions of users were creating on a daily basis. Over the past decade, Meta has spent around $160 billion in R&D and $130 billion in capex while generating cumulative gross cash flows of $280 billion.
Astonishing returns for both Alphabet and Meta Platforms. So, the answer to “Why AI now”
Because it’s been here all along!
S&P Global
Wedgewood has owned S&P Global (SPGI) for just over five years. It has been a somewhat unusual holding, in that we took an initial position of just 2.5% five years ago in late 2019, and we have neither added to nor trimmed our position since. It is time to provide an update on the Company.
Many of you will remember S&P Global used to be known as Standard & Poor’s, long known originally as a credit ratings agency and a go-to source of financial information. Founded in the 1960s by Henry Varnum Poor, the origin of the company was a series of books published by Poor providing financial and operating statistics for U.S. railroads.

Source: Archive.org
Decades later, Luther Lee Blake founded the Standard Statistics Bureau, rather brilliantly hitting on the idea of doing what Poor did, except covering every industry in the U.S. One may chuckle that this was a time and place nearly unfathomable to many of us in the investment profession, when all of the financial data we would ever need was not available at our fingertips on a PC, laptop, or smartphone. Standard, for example, delivered financial information about companies on – would you believe – index cards, which were updated (just) several times per year. We assume your intrepid investment professional of the time would consult something like a massive rolodex of index cards to evaluate potential investments for clients. Junior analysts would get the job of slipping the updated cards into place.
Over time, a series of business combinations first brought the two companies together in the 1940s. They then passed through the publisher, McGraw-Hill, for several decades before a variety of investment banking deals eventually split the company into multiple pieces, leaving us now with S&P Global – roughly returning to the heritage of the old Standard & Poor’s.
The business today offers a variety of information services, including the critical bond ratings business, where it effectively operates as a duopoly with long-time competitor Moody’s. Additionally, S&P Global runs the highly profitable market Indices business and provides broad market and commodity market data, among other services.
When we first purchased the stock, we highlighted our belief that the company could continue to grow revenues at a healthy, mid-to-high single-digit percentage range, with opportunities to improve its already outstanding, duopoly-like profitability, leading to consistent double-digit earnings growth. We expected the flagship ratings business, which generates roughly half of the company’s profits, to be a long-term beneficiary from seemingly perpetually low interest rates at that time – as central banks were also helping to spur the market by actively purchasing corporate debt. The Market Intelligence segment, a low-price information service offering, was expected to grow its user base, as it extended its customer base reaching beyond nonfinancial industry verticals. Additionally, passive asset equity flows, including the growing ETF market, were expected too to drive the highly profitable Indices segment.
Looking back over the past five years, we would say that little has changed in our thinking about the Company during our holding period. Little too has changed about the Company’s strategies or operations either. However, the shocking outbreak of Covid-19 shortly after we initiated our holding led to several years of exaggerated economic swings and aggressive government policy responses, meaning that just about nothing has been normal between 2020-2023 in relation to the Company’s market conditions. While stock performance has been reasonably solid over the past five-plus years, the stock has lagged the Russell 1000 Growth Index and the S&P 500 Index. The stock has been a relative loser for us over the entire holding period. So, you might ask us, very reasonably, how we can say that our thinking hasn’t changed, and why we still have optimism in the business?
First, fundamental performance actually has been quite good during our holding period. Revenue and earnings per share growth has accelerated during the first few years we held the stock, although there were benefits, we had not anticipated from early government and central bank responses to Covid-19. As you can see in the table below, once central banks started raising interest rates to fend off the significant levels of inflation that surged across the world, capital market activity dried up – after a period of artificially high activity – leaving the Company and many other businesses with a bit of an air pocket in 2022.
S&P Global Financial Metrics 2016-2024
|
(9 months) |
|||||||||
|
2016 |
2017 |
2018 |
201G |
2020 |
2021 |
2022 |
2023 |
2024 |
|
|
Revenue growth |
6.6% |
7.1% |
3.2% |
7.1% |
11.1% |
11.5% |
-4.0% |
11.8% |
14.0% |
|
EPS growth |
18.1% |
18.9% |
33.6% |
12.1% |
22.7% |
17.2% |
-4.0% |
12.6% |
26.0% |
Source: Company reports and FactSet Data Systems
However, moving into 2023-2024, as central banks began cutting interest rates again, you can see too that the business picked up again, growing at rates comparably favorable to the period just prior to our original purchase in 2019.
Our primary argument for the stock is that this business model is a winning model in anything resembling a normal market. Much of this business is driven by changing interest rates and corporate debt refinancing. While most evident in the 7lagship ratings business – where lower rates encourage entities to seek to more borrowing, most markets generally will be more active when rates are lower rather than higher. Lower rates beget greater capital formation, higher valuations for all types of commodities and attract more participants seeking information and opportunities to buy or sell.
The U.S. and most of the developed world have been in a declining or low-interest rate environment for decades. Government and central fiscal policy generally have been very loose since the 2007-2009 global financial crisis – in fact, all the way through the period when we first purchased this stock, as you can see in the chart showing the last 20 years of U.S. Treasury yields, below.
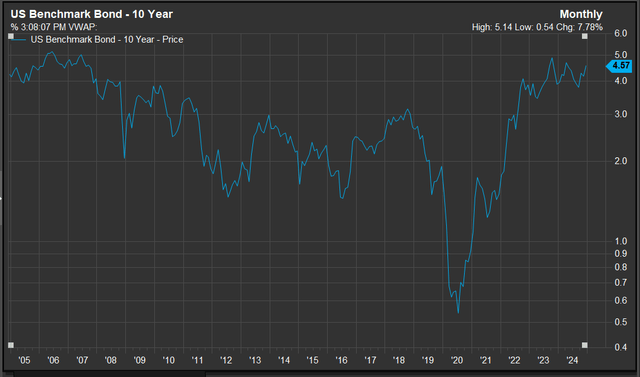
Source: FactSet Data Systems
Many of you will also know that the United States, plus much of the developed world, has been in a loosening interest rate environment for much longer, decades in fact.
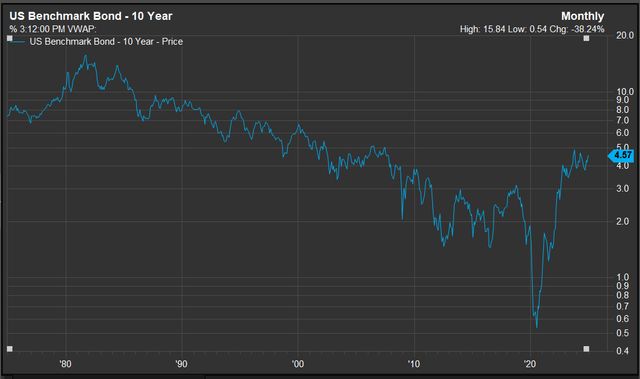
Source: FactSet Data Systems
Setting aside arguments about the rationale behind long-term Federal Reserve and federal government policy or any near-term debates about the likely outcomes of policy decisions by the incoming Trump administration, we argue that there is a clear long-term bias in favor of looser fiscal policy. One only need to see the market’s (and the Fed’s) recent fascination with bringing interest rates back down again, despite a fairly healthy economy and above- target inflation. While low interest rates have long been a tool for stimulating a struggling economy, it seems that too many participants now view low interest rates as the default. If we – and the 50 years of charts laid out above – are correct, we would argue that the last five inconsistent years of interest rates, debt issuance, and capital formation are an anomaly rather than a long-term trend, and we would expect S&P Global’s business to experience a more favorable environment over the next several years as a wall of debt refinancings loom in the next few years.
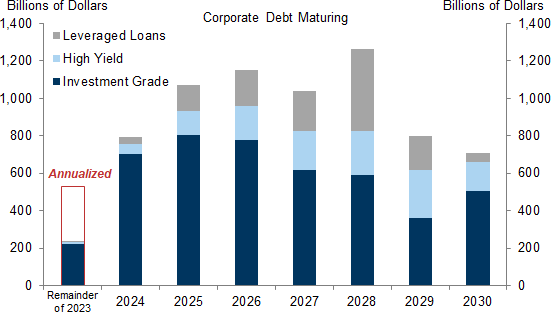
Source: Goldman Sachs
This leads us to one other factor in our investment in S&P Global: we believe the drivers of the Company’s business provide a modest hedge to our investment process. Our valuation and profitability disciplines, coupled with a large-cap growth benchmark driven dominated by technology stocks that often do not match either of these disciplines, can combine to make it more difficult for our process to beat said benchmark in the strongest market rallies. These rallies often coincide with declining interest rate cycles, or at least expectations of declining rates, just as seen in 2024. Thus, we believe it is helpful to own an attractive, profitable growth business such as S&P Global, especially because its largest ratings segment tends to be supercharged by declining rates. While we wouldn’t own the stock only for this reason, we do appreciate that this high-quality, remarkably profitable, near-monopolistic business model to perform better in environments when our investment process tends to have a relatively more difficult time.
Curb Your Enthusiasm
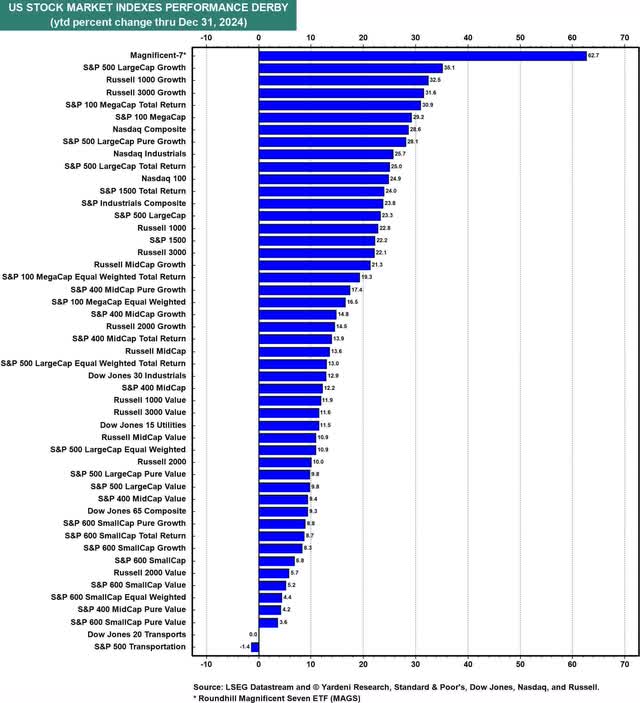
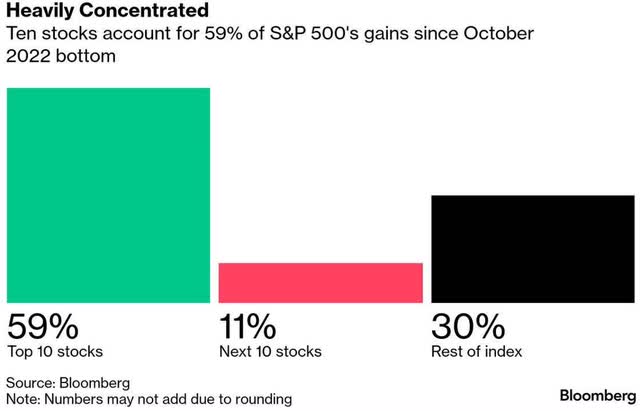
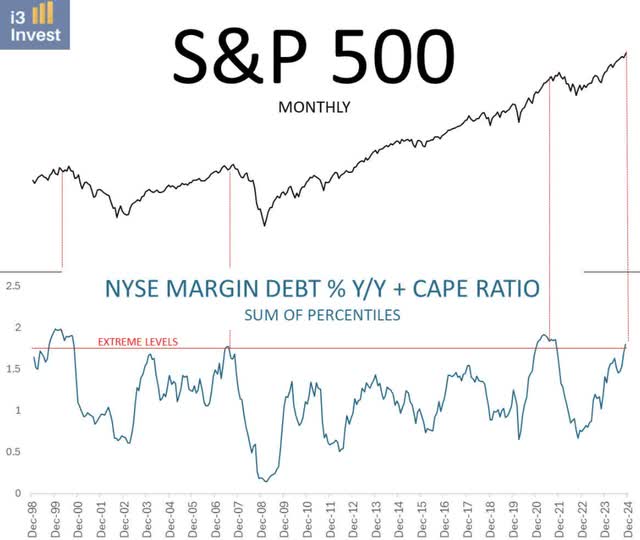
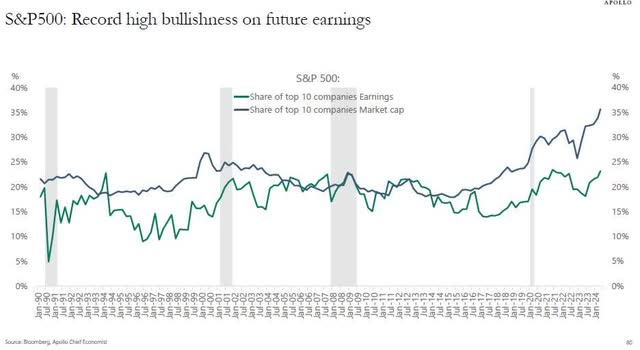
2024 was literally a repeat of 2023. The S&P 500 Index gained +25%, following a +26% gain in 2023, or +58% – posting the best two-year gain since 1997-1998. The gains in 2024 were once again led by the “Magnificent 7” – which once again, led to a challenging year for active stock pickers. (Note: The equal-weighted S&P 500 Index was up just shy of +13% in 2024 – and just +28% over the past two years.) The outsized gains in these seven technology stocks – plus a few other of the largest market cap stocks – are none too surprising given their continued collective relative outsized increased profitability, leading to outsized gains in earnings relative to the rest of the S&P 500 Index. That said, the strong multiple expansion of more than a few of the largest stocks has not been met with the same pace as earnings growth. Further highlighting this trend, Seth Golden reported that both forward corporate earnings expectations and forward P/E ratios increased by double-digits in 2024 – only the third occurrence in the past 29 years. (See following charts and graphics for additional details.)
Free cash flow margins by decade for the ten largest stocks, 1952-2024, Percent
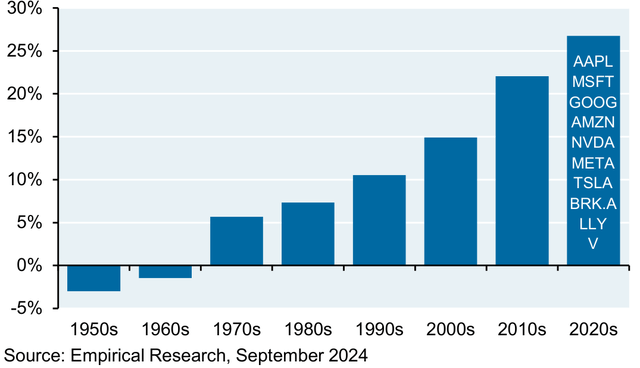
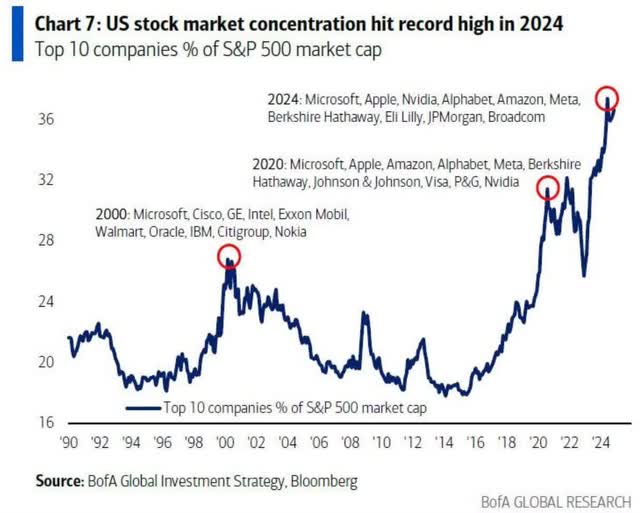
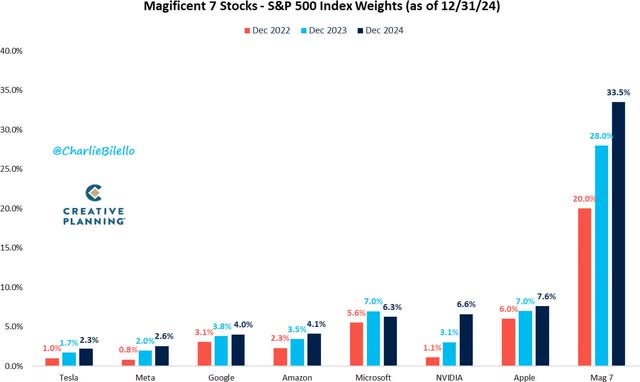
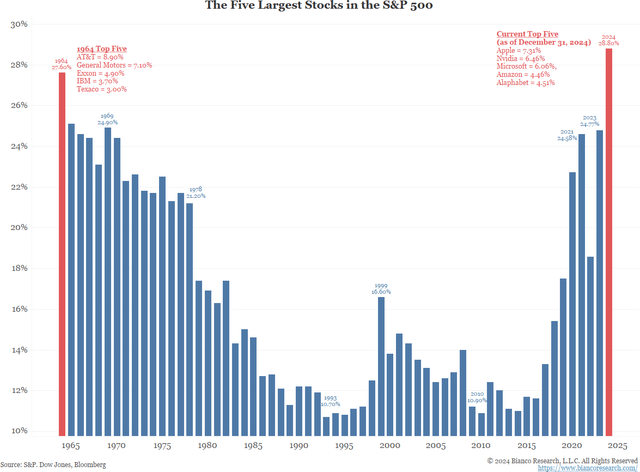
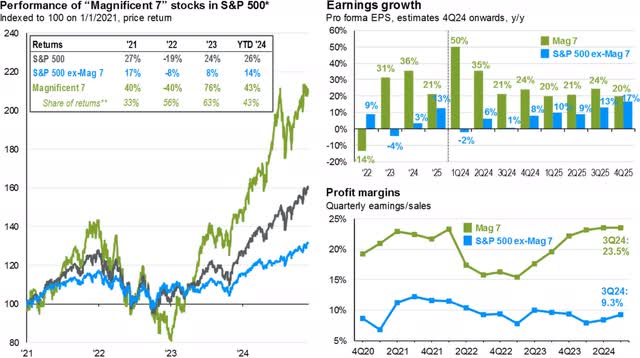
Source: J.P. Morgan Asset Management
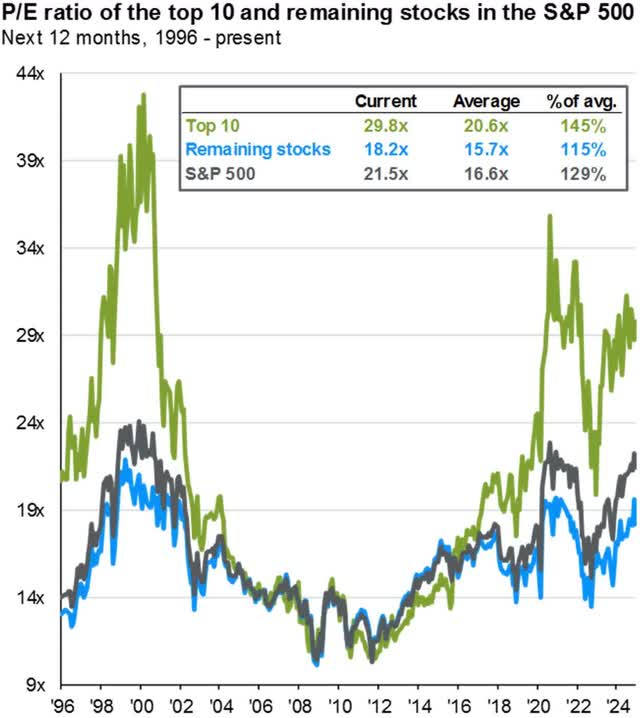
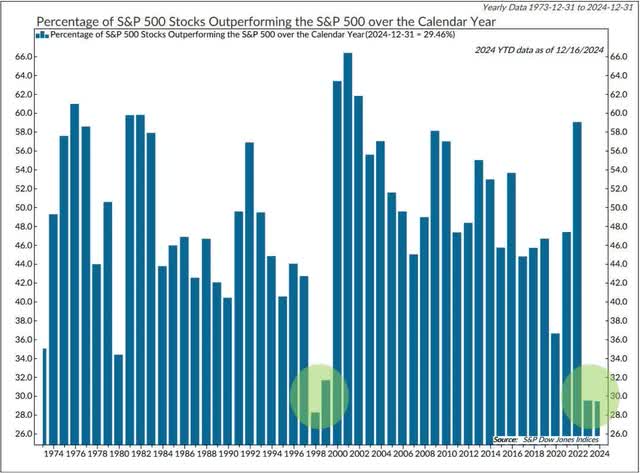
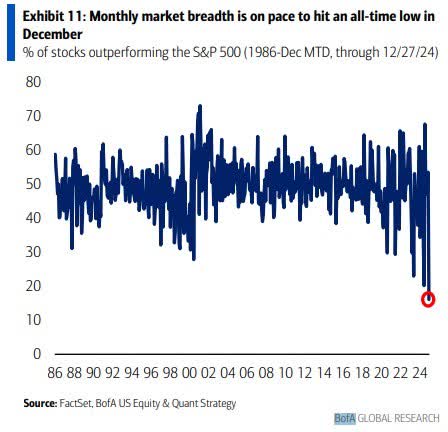
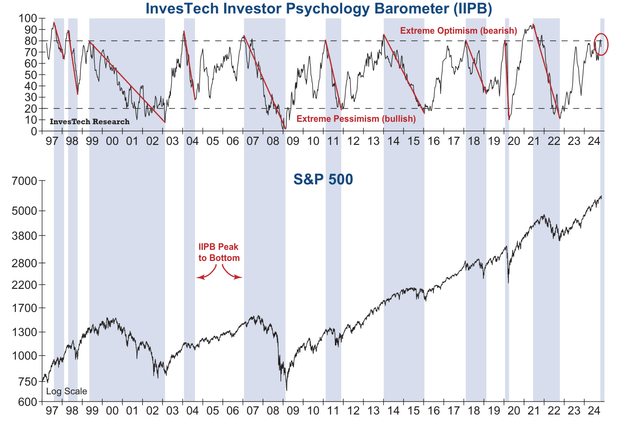
Since the short-lived Covid-19 lows in March 2020, the S&P 500 Index has gained +167%. From the short bear market lows in late 2022, the index climbed +62% and just since the brief market sell-off in late October 2023, it has gained +45%. Speculative juices are flowing. Needless to say, valuations have become worryingly stretched, while investor (speculator) expectations are literally off the charts. As far as the stock market goes, everyone seems to be in the pool.
(An aside: For sport, watch the impact – bullish or bearish – of Nvidia stock could well impact broad swaths of the stock market. The meteoric rise of the stock has been something to behold. Congratulations to current shareholders. We owned the stock some years past but completely missed the recent run. That mea culpa aside, consider a few date points from Bianco Research: Nvidia’s market cap is currently almost 12% of U.S. GDP, more than double the market cap of Cisco at the peak of the Dot-Com bubble, which was “only” 5.5% of U.S. GDP. The single stock ETF (NVDL), which offers 2X exposure to Nvidia’s price, started the year with $220 million in assets and ended the year with $5.4 billion in assets – a 24X increase. And speaking of leveraged ETFs, the Kobeissi Letter reports, “Heading into 2025, there are now 100 TIMES more assets in leveraged long funds than leveraged short funds. Over the last 8 weeks, this ratio has DOUBLED, exceeding the record high set in December 2021.” Additionally, Bloomberg notes that assets in leveraged-long ETFs exceed bearish inverse funds by a record almost 12 times!)
InvesTech Investor Psychology Barometer (IIPB)
In our view, the positive fundamentals underlying the gains in the stock market in 2024 may portend net-bullish tides in 2025. That said, here a few of our favorite worrying things in 2025:
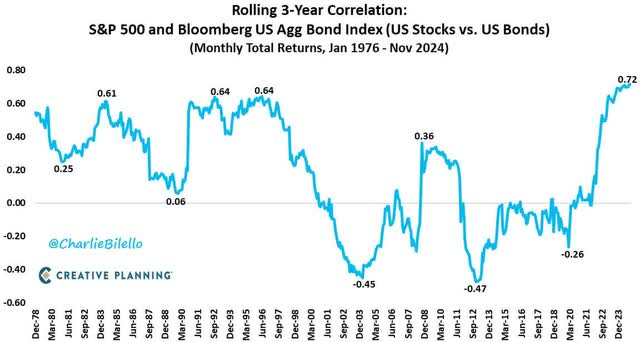
- The bond market and stock market are hip-tied at correlations rarely experienced over the past half-century. As such, the bond market tail may considerably wag the stock market dog in 2025. For stock prices to rise materially higher, bond prices must advance in lockstep – which would likely require lower longer-term interest rates – plus a lower U.S dollar, which currently sits a 26-month highs.
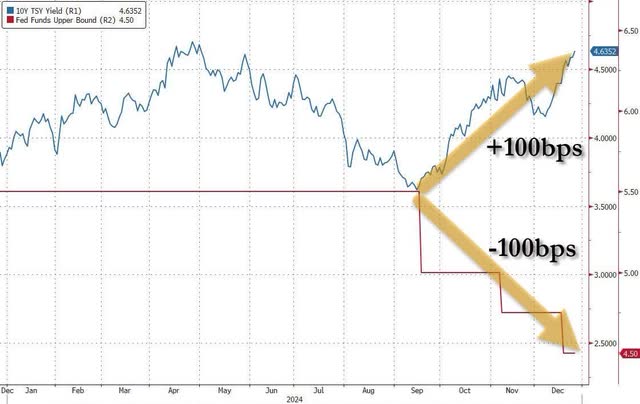
- Bond vigilantes punishing reaction to continued Federal Reserve easing, as if Powell & Co. are making a (another?) policy mistake in the face of rising in7lation expectations, which have pushed yields higher, (now 4.8% from 3.6% just last September) – which paradoxically exerts a tightening effect as a headwind to economic growth.
Source: Zero Hedge
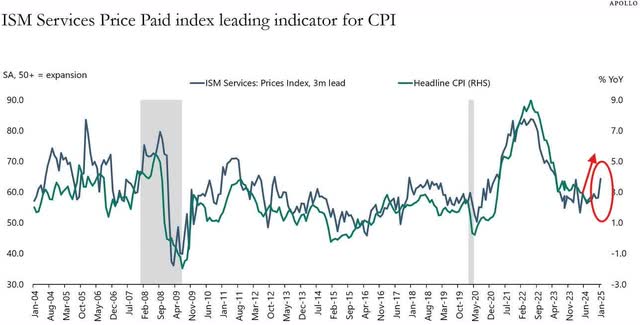
- The Kobeissi Letter reports the most recent ISM data, a key leading indicator for CPI, shows prices paid by purchasing managers are at 22-month high. Notably, the last time ISM Prices Paid were this high was in February 2023. In7lation in the U.S. then was+6.0%.
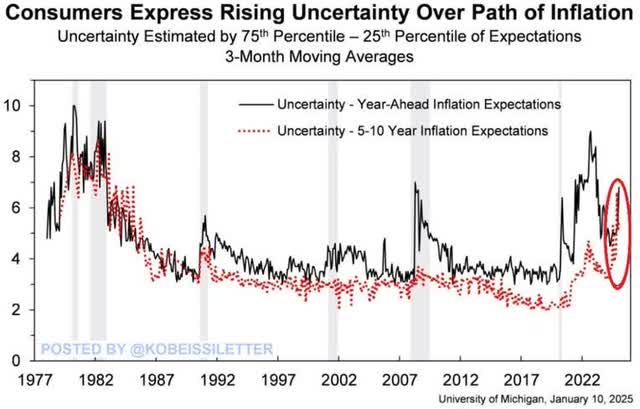
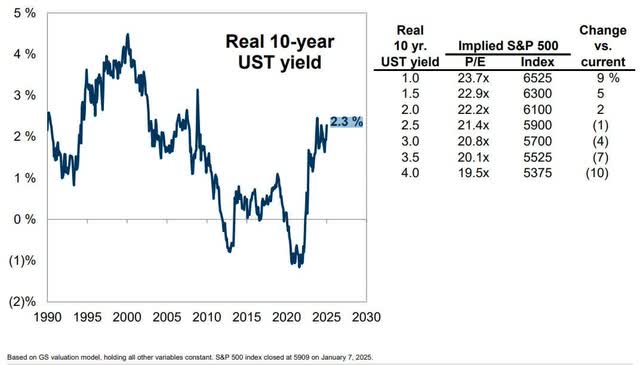
- Simply put, rising real bond yields will serve, at a minimum, as a valuation headwind or tailwind on stock prices. So far, in early 2025, they are a headwind.
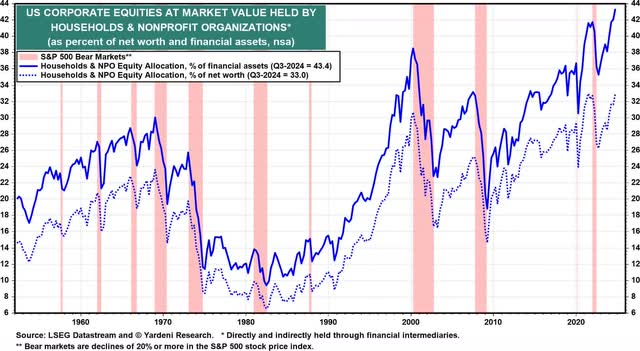
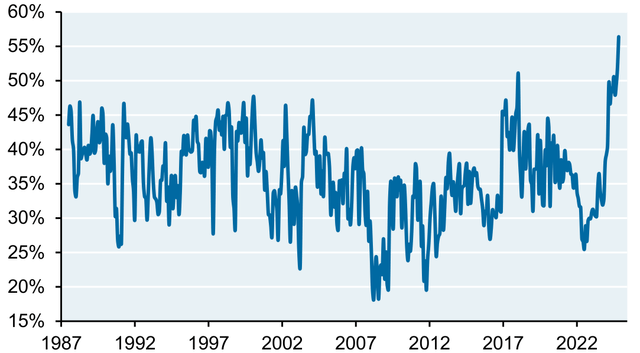
- John and Jane Q. Investor may need to curb their stock market enthusiasm. Households now hold historically outsized weighting in stocks. If bond yields continue their ascent, bonds will become quite attractive competition to future stock returns.
Share of US households expecting higher stock prices in 12 months, Percent of respondents
Source: Conference Board, Bloomberg, JPMAM, November 30, 2024
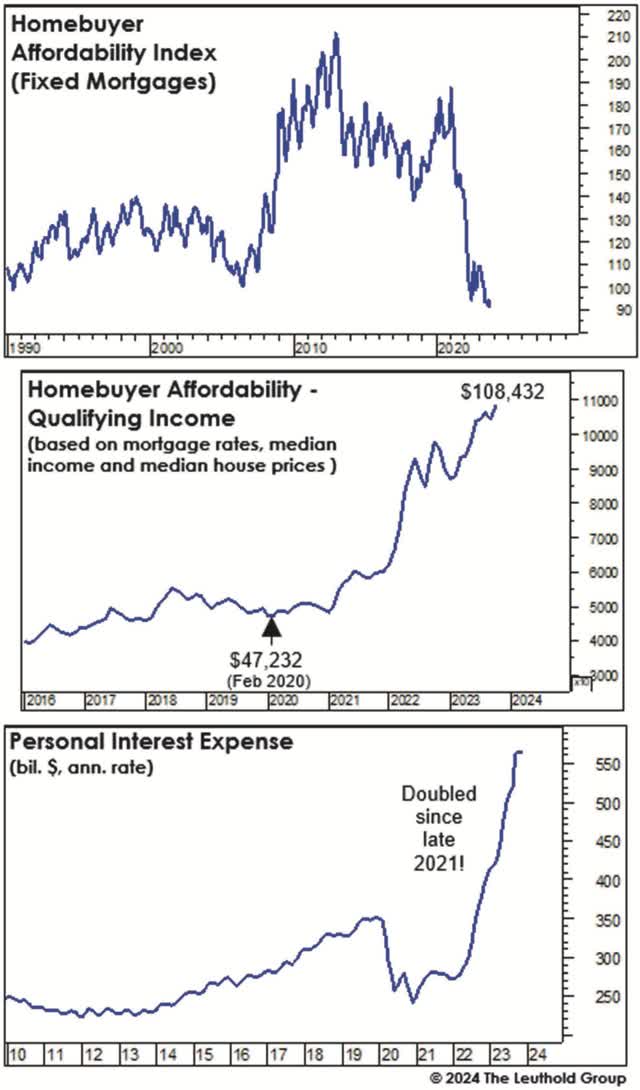
- The economy cannot sustain high nominal growth without the force multiplier inherent in the broad housing economy.
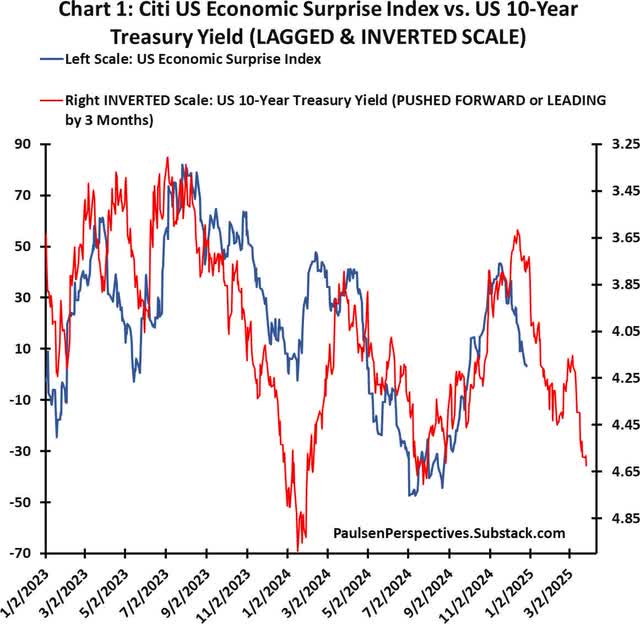
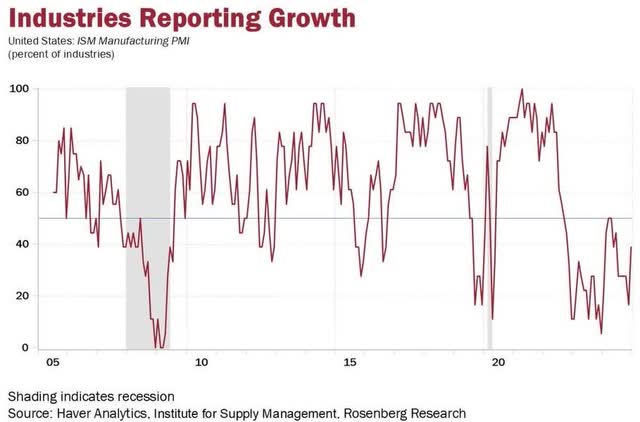
- Technology stocks have dramatically outperformed the S&P 500 Index nine out of the past 10 years, seemingly impervious to changes in GDP, changes in interest rates and changes in the U.S. dollar. However, technology companies have a long history of struggling during lower levels of GDP growth or extreme levels of higher U.S. dollar exchange rates. According to Charlie Bilello,“the ISM Manufacturing PMI has been below 50 (in contraction) for 25 out of the last 26 months. With data going back to 1948, that’s never happened before.” This means 2025 could well test technology stocks decade-long open field running versus most other stocks.
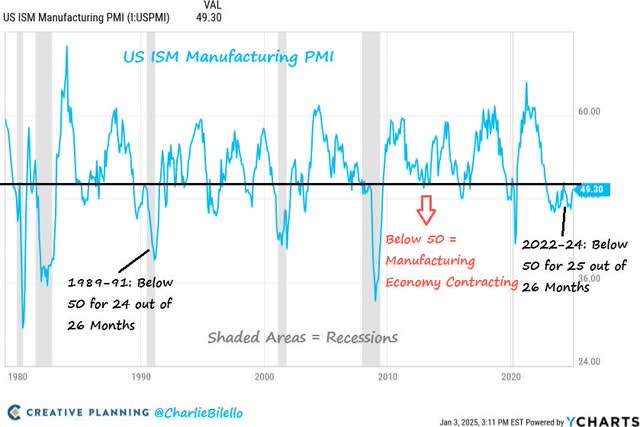
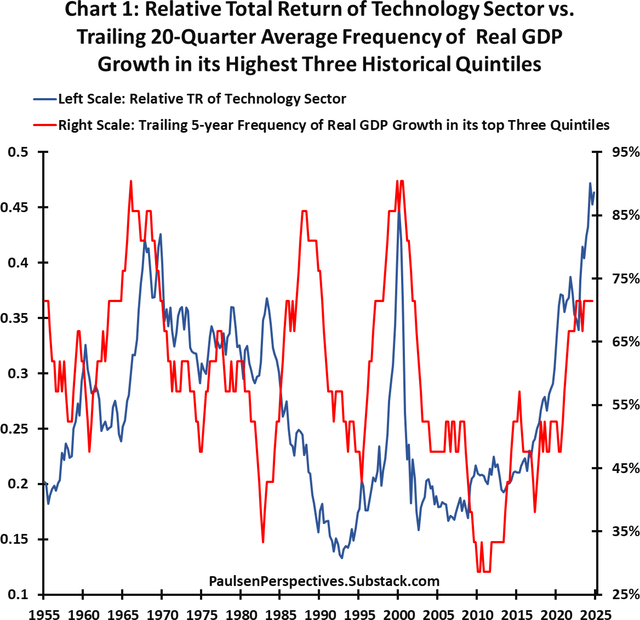
- Will the U.S. manufacturing sector break out of its multiyear recession in 2025? If so, opportunity knocks here.
We also worry about the size, scale and scope of the U.S. federal debt. Admittedly, we recall similar worries when we started in this business of ours long back in the mid-1980s. Yet, such worries over the past approaching four decades seem now to have been a waste of worry and time. Maybe debt and deficits don’t matter after all. Today, we doubt it though – particularly given the skyrocketing cost to finance our skyrocketing national debt. Ultimately, bond vigilantes will render the market’s verdict on this score – particularly if the risk that the Fed may need to reverse course in 2025 and once again raise rates if inflation heats up again.
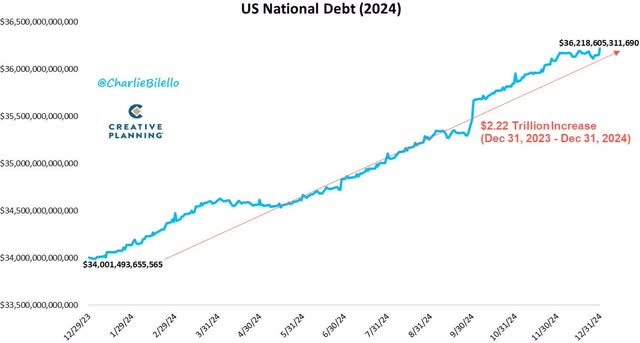
We’ve rarely commented on debt and deficits in these Letters over the past few decades. We are the first to admit our analytical limitations on such matters. However, when we consider the following facts and figures circa-2025 we do take pause of the meaning of it all – particularly the nearer future path of longer-term interest rates:
- The U.S. holds a record $36.2 trillion of national debt.
- Since 2020, total U.S. debt has increased by $10 trillion.
- The U.S debt increased by $2.2 trillion in 2024, following increases of $2.6 trillion in 2023, $1.8 trillion in 2022, $1.9 trillion in 2021, and $4.5 trillion in 2020.
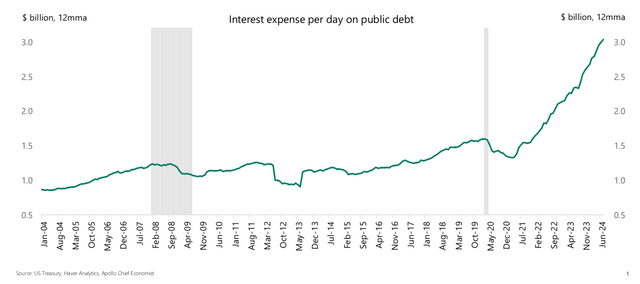
- Annualized interest expense on U.S. debt has eclipsed $1 trillion and is quickly rising. Just 2 years ago, annual interest expense on U.S. debt was “only” $450 billion.
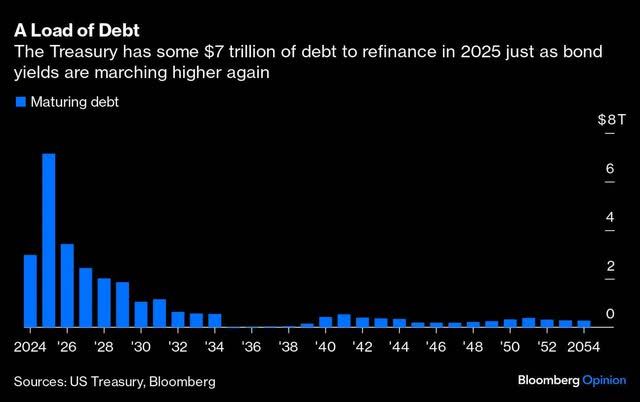
- Deficit spending over the past few years has been financed “on the cheap” with gigantic issuances of short-term debt. That “cheap” must be refinanced to the tune of$7 trillion in 2025 at likely markedly higher interest rates.
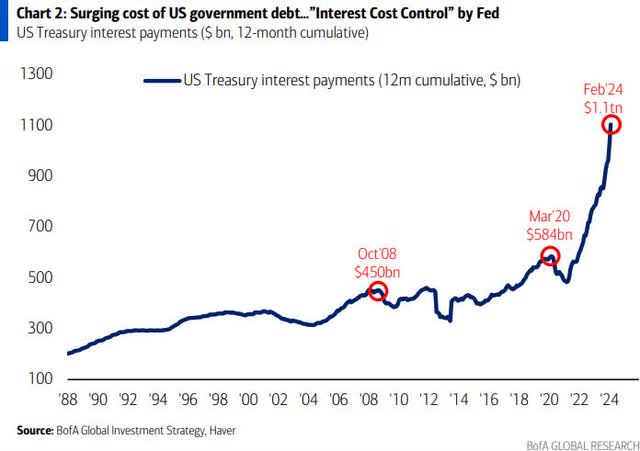
Average interest expense on US government debt now over $3 billion per day
In the annals of the most exclusive U.S. clubs – think Augusta National, The Knick, The Union Club, Cosmo Club, Fishers Island, The California Club, Cypress Point and Pine Valley – finance has its own elite circle: the exclusive dealer network of U.S. treasury primary dealers serving the New York Federal Reserve. Since 1960, membership has been by exclusive invitation only. Membership has long conferred unique privileges – and of course, unique profits. However, by circa-2024, risks have mounted as dealer balance sheet holdings of U.S. Treasuries have escalated into record territory.
Dealer Holdings of US Treasuries Are at an All-Time High
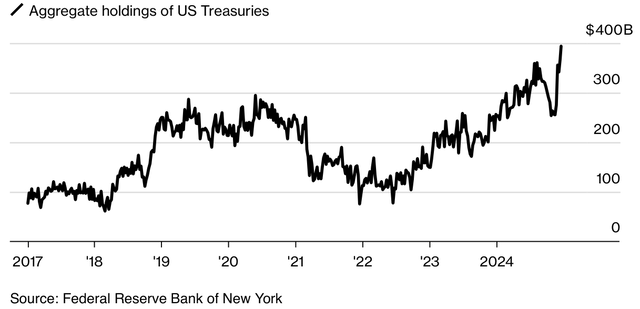
According to the Federal Reserve Bank of New York, there are currently two dozen primary dealer members. Handling the nations financing “plumbing” of $32 trillion in debt baggage is not white-shoe bean bag these days. The debt’s size, complexity, liquidity and attendant primary dealer ever shrinking relative balance sheet size will see to that. One more worry to add to the list.
Finally, our concerns on stock specific valuations are evident in our recent sale of Texas Pacific Land, and our relative benchmark underweights in Apple and Microsoft. By comparison, the 12-month forward P/Es of our three largest holdings (Alphabet, Meta Platforms and Taiwan Semiconductor Manufacturing) chime in at more reasonable valuations of 21X, 24X and 23X, respectively.
At Wedgewood, we’ve curbed our enthusiasm. We expect greater stock market volatility in 2025 than witnessed last year. Accordingly, we are patiently waiting for better prices for both new positions, as well as adding to existing positions.
January 2025
|
David A. Rolfe, CFA |
Michael X. Quigley, CFA |
Christopher T. Jersan, CFA |
|
Chief Investment Officer |
Senior Portfolio Manager |
Portfolio Manager |
|
The information and statistical data contained herein have been obtained from sources, which we believe to be reliable, but in no way are warranted by us to accuracy or completeness. We do not undertake to advise you as to any change in Figures or our views. This is not a solicitation of any order to buy or sell. We, our affiliates and any officer, director or stockholder or any member of their families, may have a position in and may from time to time purchase or sell any of the above mentioned or related securities. Past results are no guarantee of future results. This report includes candid statements and observations regarding investment strategies, individual securities, and economic and market conditions; however, there is no guarantee that these statements, opinions or forecasts will prove to be correct. These comments may also include the expression of opinions that are speculative in nature and should not be relied on as statements of fact. Wedgewood Partners is committed to communicating with our investment partners as candidly as possible because we believe our investors benefit from understanding our investment philosophy, investment process, stock selection methodology and investor temperament. Our views and opinions include “forward-looking statements” which may or may not be accurate over the long term. Forward-looking statements can be identified by words like “believe,” “think,” “expect,” “anticipate,” or similar expressions. You should not place undue reliance on forward-looking statements, which are current as of the date of this report. We disclaim any obligation to update or alter any forward-looking statements, whether as a result of new information, future events or otherwise. While we believe we have a reasonable basis for our appraisals and we have confidence in our opinions, actual results may differ materially from those we anticipate. The information provided in this material should not be considered a recommendation to buy, sell or hold any particular security. |
Original Post
Editor’s Note: The summary bullets for this article were chosen by Seeking Alpha editors.
Editor’s Note: This article discusses one or more securities that do not trade on a major U.S. exchange. Please be aware of the risks associated with these stocks.
Read the full article here


:max_bytes(150000):strip_icc():focal(742x450:744x452)/myka-and-james-stauffer-8-060624-da27bd3295e046248aea2776fa8cde54.jpg)


