


|
To December 31 st 2024: |
LRCP Equity Fund I Gross |
LRCP Equity Fund I Net |
S&P 500 |
Russell 2000 |
MSCI World Index |
|
Trailing 1-yr Total Return: |
52.4% |
40.3% |
25.0% |
11.5% |
21.6% |
|
Trailing 2-yr Total Return: |
108.0% |
80.1% |
57.8% |
30.4% |
50.5% |
|
Trailing 3-yr Total Return: |
134.0% |
98.7% |
29.2% |
3.7% |
23.9% |
|
Trailing 4-yr Total Return: |
231.9% |
163.1% |
66.3% |
19.0% |
51.6% |
|
Trailing 5-yr Total Return: |
267.0% |
186.8% |
96.9% |
42.8% |
76.6% |
|
Trailing 6-yr Total Return: |
276.2% |
193.9% |
158.9% |
79.2% |
126.3% |
|
Trailing 7-yr Total Return: |
261.9% |
182.8% |
147.5% |
57.4% |
110.6% |
| The figures above are on a cumulative basis and are unaudited. Future results will also be presented on a cumulative basis in this section. Annual results will be illustrated below for those who wish to measure us based on 12-month cycles. However, we view the cumulative results as most meaningful since we are trying to build wealth far into the future and the annual results are only important in as much as they contribute to a 3, 5, 10, and 20-year track record. |
|
Annual Results: 2024: |
LRCP Equity Fund I Gross 52.4% |
LRCP Equity Fund I Net 40.3% |
S&P 500 Energy 5.7% |
AMZ 24.4% |
XAL -1.0% |
|
2023: |
36.5% |
28.4% |
-.6% |
26.6% |
28.2% |
|
2022: |
12.5% |
10.3% |
64.2% |
30.5% |
-35.0% |
|
2021: |
41.8% |
32.4% |
53.3% |
39.9% |
-1.7% |
|
2020: |
10.6% |
9.0% |
-33.7% |
-28.8% |
-24.2% |
|
2019: |
2.5% |
2.5% |
11.8% |
6.5% |
21.3% |
|
2018: |
-3.8% |
-3.8% |
-18.1% |
-12.4% |
-22.4% |
| To reiterate, our goal is to have good absolute returns first and foremost, which should lead to good relative returns versus the broader markets. However, I also think it’s important to highlight the performance of the primary sectors in which we feel we have an advantage and in which we invest. There is no reason to present this other than for transparency reasons. Owning a highly concentrated portfolio will prevent our results from looking like anything we compare them to in most years, but knowing the performance of energy broadly, midstream energy specifically, and North American airlines will add some context for those partners who wish to do some higher-level analysis. Please see the accompanying disclaimer & footnotes at the end of the letter for a broader description of each of these indices. |
RESULTS FOR 2024
Our partnership returned 52.4% gross and 40.3% net of performance fees in 2024.
Selling is hard! The punchline is that we completely exited our Vistra (VST) position 2-weeks ago, selling our final block of shares around $170, but we’re hardly clairvoyant. In fact, almost immediately our sale looked premature as the stock subsequently jumped to $199, and then a few days later the stock went down 28% to $137 on a report Chinese AI startup DeepSeek (DEEPSEEK) uses significantly less capital and energy in their AI model than incumbent US versions. I had to scramble to my laptop and delete about 20% of what I had written for this year-end letter. It just didn’t resonate as much after Monday. The entire first page of the first iteration was spent admonishing myself for not slowing down the pace of share sales to capture a higher price and then went on talking about lessons learned from focusing solely on valuation when I should have stepped back and looked at the bigger picture. We still left a lot of money on the table to be sure, even after this week’s sell-off, but the past few days just reiterated a lesson we’re familiar with: know what you don’t know, and embrace it.
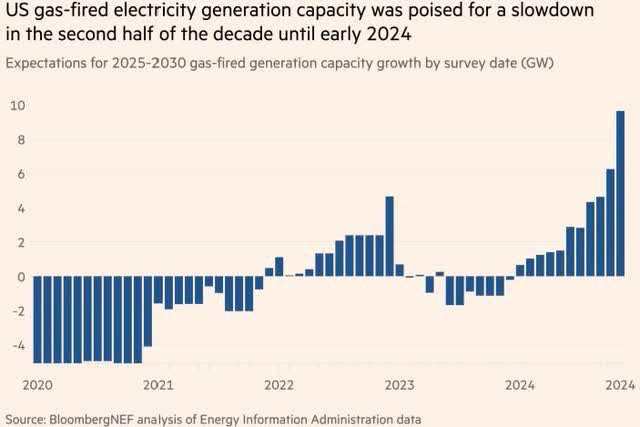
If you go back and read our prior letters, you’ll find us arguing that the Independent Power Producers (IPPs) were valued as if demand for their product (electricity) was declining, which we didn’t think was the case. We argued power demand was stable, and pricing was resilient, albeit volatile, due to the forced closure of fossil fuel plants and increasing amounts of intermittent power supply (renewables). We also thought company capital allocation policies would take advantage of that disconnect until everyone else woke up and realized what we realized with respect to demand, then voila, a 20% FCF yield would compress to 10%, and on a much smaller share count. But, in 2024 consensus power demand expectations blew right past stable on their way to unmitigated growth (see graph). The drastic change in expectations forced a recalculation in the terminal value math of Wall Street discounted cash flow models, and when paired with the excitement around Artificial Intelligence, IPP stocks took off: Vistra (VST) +262%, Talen (TLN) +215%, Constellation (CEG) +95% and NRG (NRG) +79%.
After DeepSeek, I’m guessing the slope of this graph has decreased meaningfully, and I’ve seen early estimates suggesting incremental power demand could be cut in half. We were dubious about the prior change in estimates and are just as dubious about the new change in estimates. It’s not that we think they’re necessarily wrong, we just don’t think they’re reliable enough to base our investment decisions on, which was proved out this week. We recognize the risk some of the commentary and data illustrated here is outdated by next week, but that fact lends support to our focus on supply driven investment theses.
We are now happy former owners of Vistra and are grateful to Curt Morgan (ex-CEO) and Jim Burke (current CEO) for their consistent messaging and leadership in executing a shareholder friendly capital allocation plan. We’re not sure there’s anything they could have done better over the past 7-years. I believe Jim has been more resolute in his sell strategy than us (he still has his first tranche of options with a $14 strike as far as we know), even as shares appreciated over 700%. Such pay is well deserved, and we truly could not be happier for him and his team!
Portfolio Update
It’s the first time since 2020 that I can say our portfolio is noticeably different. What has not changed is we remain highly concentrated, owning positions in only 10 companies, with the top 3 comprising 40% of the portfolio and the top 6 plus cash comprising 90% of the portfolio. In addition to exiting our Vistra position, as mentioned above, a more subtle difference is that cash is higher than it’s ever been to start a year, ~27%. This reflects our lack of success in finding new ideas big enough to replace VST, combined with a desire to have ample dry powder in the event of increased volatility.
Additionally, we had previously commented that in our opinion there was only one sector clearly out of favor, as evidenced by some of its constituent stocks breaching COVID lows. That sector was airlines, and we started allocating meaningful capital to it starting in the 3 rd quarter of last year. As I write, ~15% of the portfolio is invested in US airlines.
The table on page 2 shows the performance of the NYSE Arca Airline Index (XAL), which is one of the indices we measure ourselves against since airlines are a sector we invest in when the risk/reward is favorable. And while the XAL didn’t seem to do a great job reflecting the performance of the big US carriers last year, all of which were up, the index does have a negative total return since 2018, which speaks volumes about sentiment. By the summer of last year even industry leaders United (UAL) and Delta (DAL) were still well below their pre-COVID highs and not much above their COVID lows.
The market was suggesting the industry had reverted back to the reckless capacity growth and capital destruction it was known for prior to 2009, despite the wave of consolidation and rationalization that followed thereafter. We disagreed. We thought the industry went through a classic bullwhip effect1 as airlines tried to match supply with the unprecedented demand experienced post COVID lockdowns, which can amplify and elongate the recovery process for such a labor and capital-intensive industry. We weren’t exactly sure when the sector would make the turn, but it seems to be there now.
FOLLOWING THE CAPITAL CYCLE
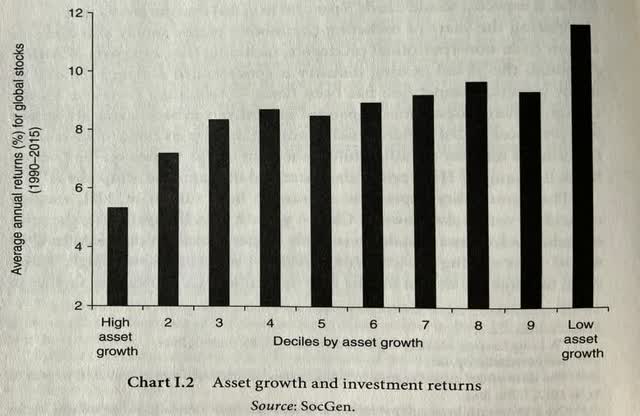
At its core we believe investing is a fairly simple endeavor and we try to approach it as such. As Nick Sleep would say, it’s all about cash in, cash out. Just hope the cash coming out is more than the cash that went in. It’s why we tend to gravitate to high dividends and large share repurchases—they make the math easier! In general, we also believe that what’s popular is more than likely a bad investment and what’s not popular at the very least has the initial ingredients of a good investment. Popular investments attract capital, which attracts competition, which ultimately depresses returns. Unpopular investments get capital taken away, competition exits, and returns stabilize if not improve. Marathon Asset Management wrote about this Capital Cycle in their Global Investment Reviews which were then compiled into two books: Capital Account and Capital Returns. This chart from Capital Returns illustrates the inverse relationship between asset growth and global stock returns from 1990-2015.
These two books have had a big influence on my thinking over the years. Our increased investment in airlines combined with our divestment of IPPs during the past several months is largely a reaction to the Capital Cycle: supply is expanding in one industry while slowing in the other. Lucky for us this also coincided with plummeting share prices in one sector, while share prices in the other went straight up.
Gas Fired Power Generation
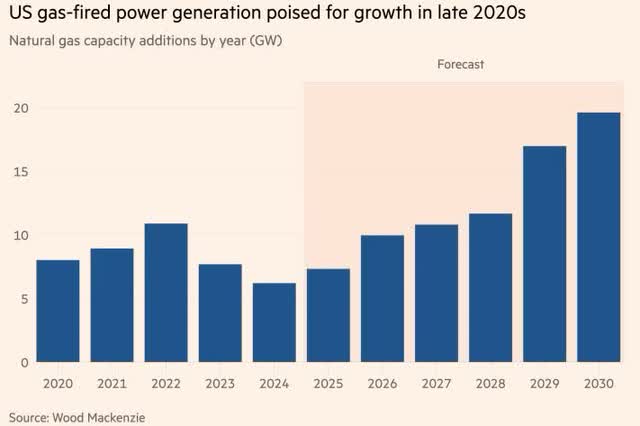
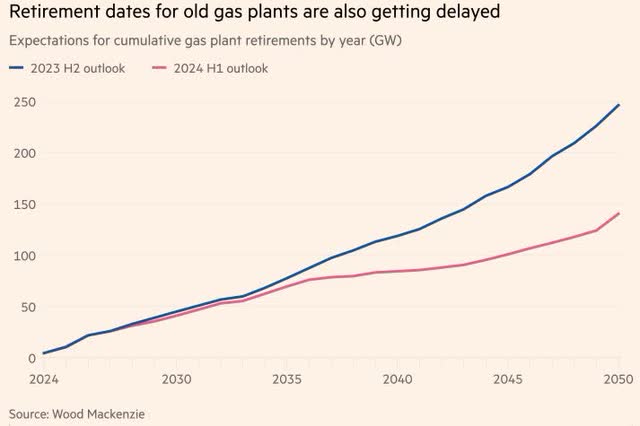
US power demand is expected to grow close to 16% over the next 5-years, which is three times last year’s estimate and a growth rate comparable to that exiting World War II. It also compares to actual demand growth of 1% a year over the past two decades. To meet this demand, Wood Mackenzie estimates that over the next 5-years the supply of US natural gas-fired power generation will increase 35% more than it increased the prior 5- years, while S&P Global Market Intelligence assumes an even bigger 66% increase. Additionally, incentives to retire old gas-fired plants are decreasing and decommissioning is getting pushed out.
And natural gas-fired power isn’t the only source of electricity generation getting a supply- side push, it’s just the shortest cycle. Small Modular Nuclear Reactors (SMRs), the restart of mothballed large reactors, delayed retirement of coal-fired plants, and the drive for more renewable power only adds to our concern that the risks are increasing that power supply could get overbuilt. Additionally, predicting when some of these facilities come online is nearly impossible, so at a minimum finding a supply/demand equilibrium will be lumpy, and once commissioned most of these assets have a 50+ year life. If investors do not get the demand side of the equation correct the industry is in for years of financial agony, akin to the early 2000’s.
The conclusion for Nate and I is that even putting valuation aside (and valuation isn’t that great anymore), the assumptions required to make a supply-side argument for owning IPPs at this part of the cycle has far surpassed the mental gymnastics we’re capable of, so we’re moving on.
US Airlines
While it felt like it only took about 9-months for the average investor to recognize the economics of IPPs had changed for the better, it took 9-years of consolidation, improving returns on capital, deleveraging, and share repurchases before one of the greatest investors of all time—Warren Buffett—recognized the economics of the US airline industry had changed. From 2017 to April 2020, he owned more stock in US airlines than anyone, but COVID temporarily upended the fundamentals of the sector and made it really hard to predict when they would stabilize, so he sold his position. We owned Ryanair (RYAAY) going into March 2020 and I capitulated as well but have been on the lookout for signs that industry economics were heading back toward pre-COVID levels ever since.
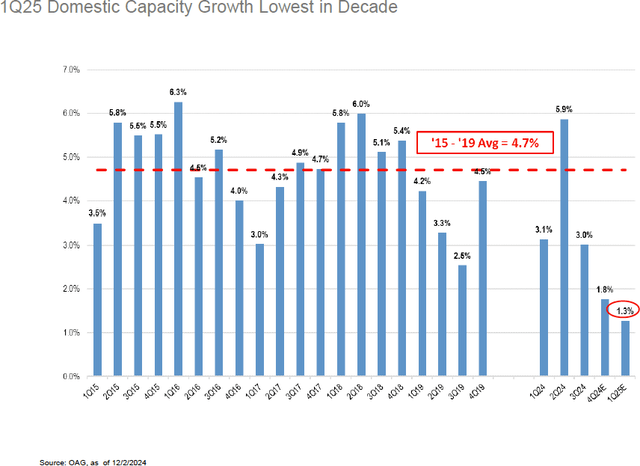
Those signs started appearing this past summer and now we’re getting tangible evidence that capacity and capital discipline are reemerging. While the graph below only shows domestic capacity growth through the 1 st quarter of 2025, it’s noteworthy that growth is the lowest it’s been in a decade. History and management commentary suggest this is the beginning of a longer trend.
JP Morgan Aviation Credit (HG/HY) 2025 Outlook
Scott Kirby, CEO of United Airlines, described“an inflection point that would kick off a multi- year run that looked a lot like 2012 to 2014 for airline earnings and investors” on the company’s 3 rd quarter call. He then followed that up on the 4 th quarter call with“two additional tailwinds this time around…structural supply constraints that are going to last at least for the rest of this decade…And second, domestically, the seeds of the 2012 to 2014 era’s demise were being sown at the time, with 15% to 20% growth from the ULCCs. It’s very hard to see that happening again.”
The impetus for these changes was underwhelming financial performance for nearly every airline with the exception of United and Delta. The poor results led to an activist campaign from Carl Icahn at JetBlue (JBLU), an activist campaign from Elliott at Southwest (LUV), and a Chapter 11 filing from Spirit (OTC:SAVEQ). The message was clear that certain airlines needed to shrink, or at least dramatically slow their growth, exit unprofitable markets, and start moving toward an acceptable return on capital or heads were going to roll.
The biggest spoiler of the prior decade’s industry rebirth was Spirit, with their irrational levels of competitive capacity growth. However, this time around CEO Ted Christie said,“the bottom line is, we need to run a smaller airline and get back on better financial footing.” Spirit filed for bankruptcy in November, is expected to exit this quarter, and will shrink meaningfully. But, in my opinion the key change over the past year is the same change that occurred in 2012 when Southwest needed to improve their financial performance. As the 2nd largest domestic carrier with over a 20% market share, and with a reputation as a market disruptor, this was, and is again, a big deal for raising the floor on fares. Back in 2012 they exercised capacity discipline by growing less than 2% for a couple of years, which resulted in improved pricing, and just as important for owners of airline stocks, much improved sentiment. Now, in addition to changing some of the most unique aspects of their business model, management is going to slow growth once again, forcing prices higher and helping to improve returns on capital. Under the watchful eye of Elliott they have committed to capacity growth of only 1-2% a year through 2027, compared to average capacity growth of 16% a year from 2021-2024.
With industry “disruptors” on their heels, issues in the supply chain are merely a side note in the supply-side driven argument for why airlines are suddenly interesting again. Those issues include Boeing’s (BA) ongoing production problems, Pratt Whitney GTF issues, and general MRO constraints. Eventually these will be remediated to varying degrees, but in the interim they are helping support our view.
Lastly, excess capital at the largest carriers has been committed to their balance sheet (Delta and American) or shareholders (United and Southwest). We endorse both forms of capital deployment, but clearly prefer the latter. Again, United’s messaging is on point. CFO Mike Leskinen:“this industry needs to get better at returning cash to shareholders. We need to have more regular returns of cash to shareholders.” Amen. The stock market gives these companies countless opportunities to repurchase shares at attractive prices, thus creating enduring long-term value for equity owners. We’ll elaborate on our thinking on this topic in future letters, but in our opinion each company should have its financial house in order (manageable leverage) and be prepared to repurchase meaningful amounts of stock when the market gets silly, which it often does with this industry. In our opinion, that’s how they can best attract the patient long-term owners they want and the valuations they deserve.
Midstream Energy
The Midstream Capital Cycle hasn’t been nearly as dynamic over the past year as US Power Generation or US Airlines, but with over 40% of our portfolio invested in the space we’d be remiss to not take a look.
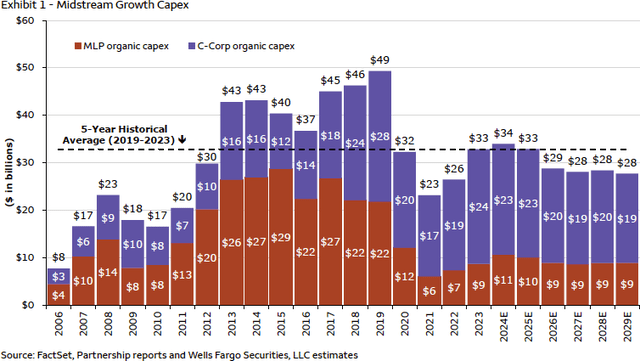
This chart from Wells Fargo illustrates that for the time being there is nothing terribly alarming with respect to the amount of capital being invested in oil and gas infrastructure. While we have come up from the lows of 2021 and 2022, we’re still 30% below the 2019 peak and approximately 23% below the average from 2013-2019, the period when midstream was trying to keep up with the US production growth brought on by the shale revolution. Compared to then we now have hydrocarbon demand pulling on midstream capex and we suspect capital spending will be higher than estimated here. If everyone’s assumptions (new & old) with respect to Data Centers and power demand are remotely correct it will be necessary.
Rich Kinder, founder of Kinder Morgan (KMI):“This is the most exciting time to be in the midstream natural gas market than I’ve seen in my long decades in this business.” And to paraphrase current KMI CEO, Kim Dang:‘We are early in data center and power demand for natural gas, we think natural gas demand will grow 28 bcf a day by 2030…I’ve seen numbers that suggest 10 bcf a day for power demand and we are only forecasting 3 bcf a day as of now, so there’s potential for upside.’
Again, these estimates might already be outdated and I’ve seen numbers suggesting KMI’s original 3 bcf a day estimate is actually spot on under the latest guestimates. Our partnership has exposure to natural gas pipelines, but we don’t own the stocks most associated with the power demand theme. Those stocks were down close to 10% last week as hopes for above average EBITDA growth through the end of the decade cooled off. The names we own will no doubt benefit from the incremental call on gas, but they also offer valuation protection. For the meantime growth capex for midstream companies is back in vogue, but we’ll certainly be on the lookout for a deteriorating Capital Cycle.
ADMINISTRATIVE
Annual Partnership expenses are approximately ~15bps (.15%). This includes costs for our Fund Administrator, a Gatekeeper2 (an extra layer of regulation required by Colorado), and research costs, which as of right now is only a subscription to FactSet (we rely on the charity of a small group of sell-side firms). The General Partner (Legacy Ridge Capital Management LLC) covers all other costs, including audit, tax, travel, etc.
When I started the fund in 2018 all of the capital invested was my own, therefore I paid all the expenses regardless of how they were allocated. Additionally, as I attracted outside capital I wanted to keep expenses low and incentivize the GP solely on performance. This still remains the case, however some of the operating expenses Nate and I currently cover should ultimately be paid by the Partnership since they’re either necessary (Tax and Audit) or beneficial to all Partners (Research). We have no intention of making changes now, but it is possible we reach out to LPs by year-end to let them know we’ll be expensing tax and audit from the fund going forward. At our current AUM and current Richey May (audit/tax) fees this would equate to an incremental 10bps (.1%) of fund expense. An extra 10bps coming off the top of our Partners’ returns makes me cringe, so unless AUM grows or Richey May fees decline (not likely) I suspect nothing will change, but I wanted to give a 12- month forewarning just in case.
Kind regards,
Kristopher P. Kelley
|
Footnotes 1 The bullwhip effect is an economic term referring to the pronounced changes in demand as you move along a supply chain, but starts at the retail level (the tail of the whip); the danger comes from each step in the supply chain estimating demand more incorrectly than the last. 2 The Gatekeeper approves all withdrawals from the partnership. We use C Lution LLC and the cost is de minimis. Disclaimer & Footnotes This letter is for informational purposes only and does not reflect all of the positions bought, sold, or held by Legacy Ridge Capital Partners Equity Fund I, LP. Any performance data is historical in nature and is not an indication of future results. All investments involve risk, including the loss of principal. Legacy Ridge Capital Management LLC disclaims any duty to provide updates to the information contained within this letter. This letter may include forward-looking statements. These forward-looking statements involve known and unknown risks, uncertainties, assumptions and other factors which may cause actual results and performance to be materially different from any future results and/or performance expressed or implied by such forward looking statements. Performance for 2018 is provided by Richey May & Associates, our auditor, and was provided via a Performance Review for a separate account that was transferred into the Fund and constituted 100% of the assets of the Fund as of November 1, 2018. Results are net of fund expenses. All performance related figures for the Partnership are unaudited. Indices are provided as market indicators only. It should not be assumed that any investment vehicles managed by Legacy Ridge Capital Management will, or intend to, match provided indices in holdings, volatility or style. Index returns supplied are believed to be accurate and reliable. The S&P 500 is a market capitalization weighted index that measures the performance of the 500 largest US based companies. The Russell 2000 Index is a market capitalization weighted index that measures the performance of the smallest 2000 stocks in the Russell 3000 Index and is a common benchmark for smaller companies. The MSCI World Index is a market capitalization weighted index that is designed to be a broad measure of equity-market performance throughout the world. It is comprised of stocks from 23 developed countries and 24 emerging markets. The AMZ is an index provided by Alerian and measures the return of 32 Master Limited Partnerships on a total return basis. The S&P 500 Energy sub-index comprises those companies included in the S&P 500 that are classified as members of the GICS energy sector. There are currently 28 constituents in the S&P 500 Energy sub-index. The XAL is the NYSE Arca Airline Index. There are currently 14 constituents in the XAL, with most domiciled in the US. This letter does not constitute an offer or solicitation to buy an interest in Legacy Ridge Capital Partners Equity Fund I, LP. Such an offer may only be made pursuant to the delivery of an approved confidential private offering memorandum to an investor. This reporting does not include certain information that should be considered relevant to an investment in Legacy Ridge Capital Managements investment vehicles, including, but not limited to significant risk factors and complex tax considerations. For more information please refer to the appropriate Memorandum and read it carefully before you invest. |
Original Post
Editor’s Note: The summary bullets for this article were chosen by Seeking Alpha editors.
Editor’s Note: This article discusses one or more securities that do not trade on a major U.S. exchange. Please be aware of the risks associated with these stocks.
Read the full article here
")
")


