

")

| Editor’s Note: This edition of our quarterly letter has taken a slightly different format. We believe our introductory essay is particularly relevant and timely. Therefore, we have dedicated more time and space than usual on the topic. We have elected to forego our other regular commodity-by-commodity sections this quarter. Not to worry – we will pick back up in the next edition. We also realize our letters have been coming out later and later each quarter. By shifting our other sections to the 1Q25 edition, we hope to release the next issue earlier in the quarter and get back onto our preferred release schedule. Thank you for your dedicated interest and understanding. |
On Commodities, Carry Regimes & Changes in Global Monetary Regimes
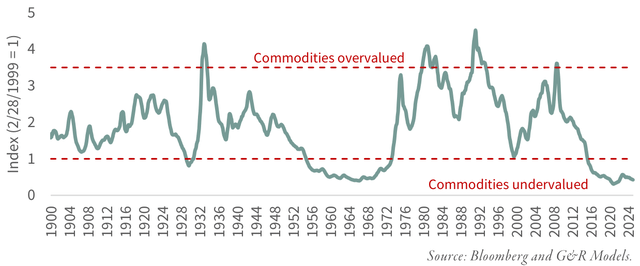
We believe the time to buy natural resource equities has arrived. History, with its characteristic flair for the dramatic, has shown that commodity markets do not simply meander- they surge and collapse in sweeping, decade-spanning cycles. Prices can climb tenfold in a matter of years, only to later crumble, resetting the stage for the next act. Time and again, we have published a particular chart that tracks the ratio of commodity prices to stocks, using the Dow Jones Industrial Average (DJI) as its benchmark. Barring the brief, COVID-induced plunge, commodities are now as undervalued relative to stocks as they have ever been. And now, fresh research suggests that the tide is about to turn-that the long-dormant natural resource bull market may be stirring once again.
FIGURE 1 Commodities – Dow Ratio
Two recent developments have prompted us to revisit this pressing subject. The first is a series of remarks-subtle but unmistakable-by members of the Trump Administration, hinting at what some have dubbed the “Mar-a-Lago Accords.” If these hints amount to more than mere rhetoric, we could be standing at the threshold of a major shift in the monetary regime. And history, in its usual unsentimental fashion, reminds us that every commodity bear cycle has met its end with precisely such a shock. We see no reason to believe this time will be any different.
If we are correct, a major shift in the global monetary system may be imminent. History offers a clear precedent: every past commodity bull market has been set in motion by a similar regime change. The policies now being proposed-whether intended or not-are likely to produce the same effect, triggering another surge in commodities and natural resource equities. Investors would do well to take heed and position their portfolios accordingly before such an event materializes.
The second development is the striking impression left on us by “The Rise of Carry,” a book by Lee, Lee, and Coldiron. The authors dissect so-called “carry regimes,” periods defined by suppressed volatility and an abundance of leverage. While their analysis does not explicitly address natural resource markets, we could not help but draw a connection. The long, dramatic cycles of commodities appear inextricably linked to these broader “carry regime” cycles. If our intuition is correct, then natural resource equities may prove to be one of the few asset classes capable of shielding investors from the eventual unwinding of today’s great carry trade.
Over the past 125 years, commodities have endured four episodes of extreme undervaluation relative to equities. The first three concluded in 1929, 1969, and 1999-each marking the start of an era in which commodities and natural resource equities dramatically outpaced the broader market.
The fourth such period began in 2011, hitting a double bottom-first in 2016 and again amid the COVID turmoil of 2020. Notably, despite a strong recovery since then, we have yet to witness the full force of the next great commodity bull market. But the signs are gathering, the pattern is familiar, and we believe an inflection point is near.
History offers a blueprint: each prolonged phase of commodity weakness has followed the same arc. A boom begins, first drawing in capital, then fueling a surge in production. Supply inevitably overtakes demand, and prices, once euphoric, collapse-shedding 75% or more in absolute terms. What follows is a period of radical undervaluation, setting the stage for the next great reversal. We have seen this before, and we suspect we are seeing it again.
The first three episodes of radical commodity undervaluation all proved to be extraordinary entry points for buyers of natural resource equities-counterintuitive as that may have seemed at the time. Even amid the stock market crash of 1929 and the ensuing Great Depression, a basket of commodity stocks purchased at the market’s peak that summer would have doubled in value by 1940, while the S&P 500 (SP500, SPX) languished at half its former high. Between 1968 and 1980, a similar portfolio of resource equities multiplied fivefold, leaving the S&P 500’s mere doubling in the dust. Natural resource stocks not only outpaced inflation but delivered positive real returns while the broader equity market suffered an inflation-adjusted loss. From 1999 to 2011, history repeated itself: commodity equities once again surged, far outstripping the S&P 500.
Each of these periods of commodity undervaluation coincided with a speculative frenzy occurring elsewhere in the market, typically centered on emerging technology. The 1920s bull market belonged to radio stocks, with Radio Corporation of America (RCA) rising an astonishing 300-fold-from $1.50 in 1920 to $505 by 1929. In the 1960s, it was semiconductors, with Fairchild Camera and Instrument-the progenitor of Fairchild Semiconductor and Intel (INTC) -soaring from $20 to $200 a share. The late 1990s saw the dot-com boom, epitomized by Cisco Systems (CSCO), which skyrocketed nearly 1,200-fold, compounding at more than 100% annually between 1990 and 2000. Most recently, the Magnificent Seven have dominated, with Nvidia (NVDA) leading the charge-its stock climbing nearly 500-fold since 2013.
History is nothing if not repetitive, and past commodity bear markets have consistently coincided with market manias centered around so-called “one decision” stocks-securities whose appeal rested on a single, overly simplistic investment rationale. These were the stocks investors could supposedly buy and hold forever, immune to valuation concerns and economic cycles, at least until reality intruded.
The “Roaring Twenties” provided the first example: a broad and exuberant rally in which nearly any investment strategy worked-except, of course, buying natural resource equities. The 1960s saw the rise of the conglomerate boom, in which high-multiple companies used their richly valued stock as currency to acquire lower-multiple firms. Financial sleight of hand manufactured earnings growth, driving valuations every higher in a self-reinforcing spiral–until the spell broke. Later the “Nifty Fifty,” a collection of blue-chip growth stocks that investors purchased on faith alone, regardless of price, became the quintessential “one decision stocks”–once you bought them you never had to sell.
The 1990s, of course, belonged to the dot-com bubble. Simply appending “.com” to a company’s name could send its stock soaring, while analysts spun elaborate justifications for valuing firms with no revenue as if they were the next General Electric. Most recently, the dominant narrative has centered on the hyperscalers, the tech giants that have captured a disproportionate share of market gains. Meanwhile, the investment landscape has tilted sharply away from active management toward passive ETFs, a shift that has further amplified the concentration of capital in a handful of mega-cap stocks.
Each prolonged period of commodity underperformance has unfolded against a backdrop of exceptionally loose credit conditions. In the latter half of the 1920s, the United States embarked on its first experiment with quantitative easing. Benjamin Strong, then Governor of the Federal Reserve Bank of New York, expanded the Fed’s balance sheet-not to support the domestic economy, which was thriving, but to shore up the struggling British pound, still burdened by the inflation and debts of World War I.
The 1960s saw a different form of excess. The U.S. government ran persistent deficits, attempting to finance both the Vietnam War and an ambitious domestic social spending agenda without imposing fiscal discipline. The 1990s, in turn, were dominated by the so-called “Greenspan Put,” a period in which Federal Reserve Chairman Alan Greenspan maintained an aggressively accommodative monetary stance even in the face of a robust economy.
Following the Global Financial Crisis, the Federal Reserve’s interventions escalated further. A series of quantitative easing programs saw the Fed’s balance sheet swell from $900 billion in 2007 to $9 trillion by 2022-a scale of monetary expansion without historical precedent.
During each of these episodes, easy money propelled the equity market to levels that would have been otherwise unattainable. Surging valuations, fueled by abundant liquidity, funneled vast sums of capital into the fastest-growing sectors of the market while draining investment from real assets, commodities, and natural resource equities. The result was a steady erosion of these sectors’ market weightings. Between 1926 and 1929, the share of energy and materials stocks in the U.S. market fell by half, from 22% to 11%. The same pattern played out in the postwar boom, as their weight dropped from 29% in 1957 to 14% by 1970. From 1980-a peak moment for resource equities-their weighting collapsed from 34% to under 5% by 2000. The most recent cycle followed suit: from their 2008 highs to the depths of the COVID-driven selloff in 2020, energy and materials declined from 17% of the S&P 500 to an all-time low of just 2.1%. While they have since recovered somewhat, their presence in the market remains marginal at a mere 3.4%.
Historically, every commodity bear market has ended with an unforeseen shift in the global monetary order. These so-called “Black Swan” events served as the necessary mechanism to correct the growing distortions in the global financial system and reprice real assets. Each of these shifts was invariably followed by a significant devaluation of the U.S. dollar (USDOLLAR,DXY) relative to gold.
The commodity bear market of the 1920s came to its inevitable conclusion when the classical gold standard was abandoned. During World War I, most European nations had suspended the gold backing of their currencies to finance the war effort, setting in motion a monetary distortion that would take more than a decade to resolve. After the Versailles Treaty in 1919, many of these countries made strained attempts to restore their currencies to prewar gold parity, with Britain leading the charge. As Chancellor of the Exchequer, Winston Churchill spearheaded a series of painful deflationary policies to strengthen the pound-a decision he would later call the greatest regret of his career. John Maynard Keynes, for his part, loudly objected, but his warnings went unheeded.
Meanwhile, across the Atlantic, Federal Reserve Governor Benjamin Strong sought to prop up the British currency by weakening the dollar, expanding the Fed’s balance sheet in the first real experiment with U.S. monetary interventionism. Yet the effort ultimately failed. Strong’s sudden death in 1928 led to the swift reversal of his policies, tightening credit conditions just as market imbalances were peaking-an abrupt shift that would contribute to the onset of the Great Depression. By 1929, the classical gold standard, which had governed the international monetary system since the end of the Napoleonic Wars, was effectively dead. In 1932, Franklin Roosevelt took matters into his own hands, outlawing private ownership of gold in the U.S. before promptly devaluing the dollar by 40%, raising the official gold price from $20.67 to $35 per ounce.
The next great commodity bear market, in the 1960s, ended with the collapse of the Bretton Woods system. In the aftermath of World War II, the United States had orchestrated a new international monetary framework, pegging the dollar to gold at $35 per ounce, with other currencies in turn pegged to the dollar. This arrangement held for two decades, but by the late 1960s, persistent U.S. deficit spending-driven by both the Vietnam War and ambitious domestic programs-led foreign governments to increasingly exchange their dollars for gold. The pressure intensified in 1968, forcing President Lyndon Johnson to intervene. He attempted to stem the outflows by urging Congress to repeal the legal requirement that the dollar be backed by at least 25% gold reserves. Instead of stabilizing the system, the move only reinforced expectations of devaluation, causing the international gold price to rise further. By 1971, with the system on the brink of collapse, President Nixon delivered the final shock: closing the gold window and ending the dollar’s convertibility into gold. Bretton Woods was no more, and over the next decade, the dollar’s value relative to gold would collapse by 95%.
The 1990s saw a period of breakneck growth across East Asia, driven by export booms and surging capital inflows. Many of these economies maintained fixed exchange rates against the U.S. dollar, a strategy that worked well so long as foreign capital continued pouring in. The implicit understanding was that, in the event of sudden capital flight, the U.S. and the International Monetary Fund (IMF) would step in with dollar swap lines to maintain stability. That understanding was put to the test in July 1997, when Thailand, unable to defend its currency, abandoned its dollar peg. The decision triggered a violent unwinding of speculative capital from emerging market currencies. Despite earlier assurances, the U.S. and the IMF withheld support, and the resulting contagion sent shockwaves through global markets. Within six months, the Thai baht had collapsed by 58%, while the Indonesian rupiah fell by 85% between 1997 and 1998.
The crisis forced a painful but necessary adjustment. Emerging market economies, unable to count on outside intervention, revalued their currencies at much lower levels to regain export competitiveness and repair their trade balances. The results were dramatic: Thailand’s current account deficit, which stood at 8% of GDP in 1996, swung to a 12.5% surplus by 1998. This marked the beginning of a new global monetary order, one that economic historian Russell Napier later dubbed the “No Name Regime.” Under this system-still in place today-the U.S. runs persistent and sizable trade deficits, while surplus nations accumulate dollars and recycle them into Treasury bonds, fueling ever-rising U.S. debt and deficits.
In the 25 years following the crisis, foreign and international investors increased their holdings of U.S. Treasuries by $7.5 trillion. Meanwhile, gold-long a barometer of confidence in monetary regimes-surged eightfold between 1999 and 2011, reflecting an effective 86% devaluation of the dollar against gold.
We have long maintained that the current period of commodity undervaluation would ultimately conclude with a fundamental shift in the global monetary order. Until recently, we expected this shift to originate from the BRIC nations. China, in particular, has spearheaded efforts to move away from the dollar in bilateral trade settlement, gradually reducing its reliance on the U.S. currency. By last year, nearly 10% of all international trade had already moved outside the dollar-based system-a quiet but unmistakable sign of change.
More recently, however, our thinking has evolved. Rather than de-dollarization being driven externally, we now believe the catalyst may emerge from within the United States itself. Instead of retreating from the dollar’s role as the global reserve currency, policymakers appear poised to double down on it, introducing a series of sweeping reforms that the media has begun referring to as the “Mar-a-Lago Accords.” Gough details remain scarce, both Treasury Secretary Bessent and proposed Council of Economic Advisors Chairman Miran have offered hints as to their likely structure. In short, the reforms are expected to include revaluing the Federal Reserve’s gold holdings, restructuring portions of the national debt, and implementing a tariff regime designed to define what Miran describes as a “global commonwealth” of allied nations. Whether these measures will succeed remains an open question, but there is no doubt they represent a fundamental break from the existing global monetary framework.
At our Investor Day in New York this past October, we had the opportunity to interview Neil Howe, author of “The Fourth Turning.” Howe’s thesis outlines an 80-to-100-year cycle in American history, in which institutional structures are periodically dismantled and rebuilt in response to profound crises. He argues that we are currently in the midst of one such turning, the last having reached its climax during World War II. Within this framework, President Trump, Secretary Bessent, and Miran emerge as figures not of continuity, but of radical institutional transformation and disruption.
Historically, similar changes have ushered in a period of commodity outperformance relative to the broader market.
But this is not merely a concern for commodity investors. As we reflected on “The Rise of Carry,” it became evident that the commodity bear market is only one facet of a much broader cycle-the carry regime. The authors illustrate how carry bubbles permeate every asset class, creating a false sense of diversification. In reality, most investors have unwittingly doubled down on their exposure to carry trades, leaving them dangerously vulnerable to an unwind. The most recent instance came in 2022, when the S&P 500, the Bloomberg U.S. Bond Index, and the Bloomberg All Hedge Fund Index all declined between 6% and 28%, illustrating how deeply entrenched the carry trade had become.
For true protection against a carry unwind, investors must actively seek exposure to areas outside the carry regime. The events of 2022 provide a useful case study. While most asset classes suffered, energy stocks in the S&P 500 surged 65% even as the broader index plunged nearly 20%. The lesson is clear: when the cycle turns, capital flows shift dramatically, and those positioned correctly stand to benefit.
What exactly is a carry regime? The authors of “The Rise of Carry” begin with its most classic example: borrowing in a low-interest-rate currency-typically the Japanese yen- and investing in a higher-yielding economy, such as Australia. As long as the yen does not appreciate too aggressively against the Australian dollar, the investor earns a positive “carry” return-the difference between the cost of borrowing and the yield on the investment. Studies have shown that hedging future currency risk can create what appears to be a persistent arbitrage.
However, Lee, Lee, and Coldiron make a crucial observation: many investments not traditionally considered carry trades share the same fundamental characteristics and function in much the same way. They broaden the definition of a carry trade to encompass any investment that relies on leverage and is structurally short volatility. The underlying principle is simple: as long as initial conditions hold-specifically, that volatility remains low-the investment delivers a steady, positive expected return. In the case of the classic yen-Australia carry, the trade is profitable so long as the exchange rate remains within expectations. If tomorrow looks like today, the bet pays off.
But herein lies the danger. During extended periods of low volatility, capital floods into these trades, amplifying the perceived arbitrage and pushing asset prices higher. The more money that piles in, the greater the eventual mispricing, and the more precarious the rally becomes. Given the highly leveraged nature of these trades, the unwinding of the bubble is often violent. Traders have long referred to carry trades as akin to “picking up pennies in front of a steamroller”-a strategy that delivers steady, modest returns so long as conditions remain stable, but one that collapses catastrophically the moment volatility reappears.
Any large, leveraged short-volatility bubble produces a series of highly predictable outcomes. First, the sheer volume of capital chasing short-volatility strategies suppresses volatility itself. The more investors pile in, the more yesterday’s trade continues to work today, creating a self-reinforcing cycle. Capital floods into momentum strategies, rewarding size over value. Large-cap equities, which attract the most inflows, outperform smaller companies. Value investing, which depends on the eventual recognition of mis-pricings, lags behind growth investing, which thrives on investors extrapolating recent success far into the future. Risk premiums compress as volatility remains subdued, driving yields across asset classes toward historically low levels. As equity risk premiums erode, asset prices surge, fueling an unprecedented hyper-financialization. The stock market’s capitalization expands at a rate far outpacing the underlying economy. This unique market structure-one where leverage, compressed risk premiums, and capital concentration define the investment landscape-is what the authors refer to as a “carry regime.”
Lee, Lee, and Coldiron focus on the most recent carry regime, which took hold in the aftermath of the Global Financial Crisis. Since the S&P 500 bottomed in March 2009, it has delivered an extraordinary 16.3% compounded annual growth rate (‘CAGR’)-nearly three times the 5.7% CAGR observed between 1927 and 2009. Volatility was systematically suppressed, with the standard deviation of monthly returns running nearly 25% lower than in the prior 82 years. Equity valuations expanded, driving earnings yields lower, while the spread between the Case-Shiller P/E ratio and the risk-free rate collapsed by 82%, from 7.3% to just 1.2%, as yields across asset classes converged.
In such an environment, “buying the dip” became more than just a trading strategy-it became dogma. The short-volatility trade proved remarkably profitable, interrupted only briefly by the “vol-mageddon” shock of 2018. And like all carry regimes, this one relied on ample leverage. By 2020, negative-yielding debt had ballooned to $18 trillion. Equity margin loans, a direct measure of market leverage, swelled from $120 billion in 2009 to $500 billion by 2021. The conditions were textbook: a low-volatility, high-leverage boom that, like its predecessors, was bound to eventually hit its breaking point.
Carry regimes create a powerful feedback loop, continuously attracting more capital into the trade and allowing it to expand well beyond fundamental limits. The end result has been an unprecedented hyper-financialization, in which U.S. public equity markets have swelled to over 200% of GDP-the highest level in history.
As capital flooded into carry trades, equity returns became increasingly concentrated among the largest winners. Cheap financing and suppressed volatility rewarded success with even more success, pushing the strongest stocks even higher. The result: the largest 10% of stocks by capitalization now account for a staggering 75% of the total market-the highest level of concentration in a century.
Momentum strategies thrived, diverting capital away from active management and into passive strategies. As the market’s biggest stocks continued their relentless rise, they became increasingly dominant in capitalization-weighted indices, further entrenching their position. This, in turn, made it more difficult for active managers to outperform, reinforcing the appeal of passive investing. The cycle fed on itself: passive strategies’ outperformance attracted even greater inflows, keeping the momentum trade alive. Trillions of dollars that once flowed into actively managed mutual funds were instead funneled into passive ETFs, further accelerating the shift and deepening the concentration of market leadership.
A carry regime will continue to expand as long as it appears to be working, regardless of underlying fundamentals. Because it diverts capital in a way that ignores fundamental value, it inevitably misprices risk and distorts capital allocation. These distortions create structural imbalances. One of the most notable is that the combination of cheap capital and suppressed volatility leads investors to assign higher valuations to long-dated and uncertain cash flows. As a result, in contrast to historical norms, carry regimes tend to see growth stocks outperform value stocks. High-multiple, high-growth, long-duration assets benefit disproportionately, while tangible assets-commodities and natural resource equities-are left starved of capital.
As capital flees, the performance of commodity and natural resource stocks deteriorates, reinforcing their neglect. Momentum strategies exacerbate the trend, driving these stocks lower still. Hedge funds, spotting an easy trade, pile in on the short side. With few natural buyers remaining, prices plunge.
The proliferation of alternative investments-most notably hedge funds and private equity- is both a symptom and an accelerant of a carry regime. Hedge funds are key agents of the system because of their compensation structure: managers collect a percentage of investment gains but are not similarly penalized for losses. This asymmetry incentivizes short-volatility strategies. As long as tomorrow looks like today, they capture supernormal profits without the expectation of repaying them when the inevitable shock arrives. The failure of Long-Term Capital Management in 1998 remains the quintessential example of how hedge funds gravitate toward, and further reinforce, the leveraged short-volatility mindset.
Private equity funds are even more direct participants in carry regimes. Geir entire business model depends on borrowing vast sums of cheap debt to acquire companies. As long as the cost of capital remains low and market conditions remain stable, they can generate above market returns, extracting enormous fees in the process. So long as the cycle persists, the rewards are immense-but, like all carry trades, the strategy relies on a world that does not change.
Rather than providing diversification, many alternative investments actually deepen an investor’s exposure to the carry regime. During a carry unwind-most recently experienced in 2022-these supposedly uncorrelated assets often fall in tandem, revealing their hidden linkages. What was once thought to be a hedge turns out to be merely another expression of the same trade.
Natural resource equities, by contrast, largely exist outside the carry regime. Unlike long-duration, high-growth assets, they do not attract massive capital inflows during periods of suppressed volatility and cheap financing. Once they begin underperforming, they take on the characteristics least desirable in a carry regime: value and negative momentum. As a result, they are systematically starved of capital. However, when the cycle turns, their detachment from the prevailing financial regime can become a rare advantage. During the 2022 carry unwind, energy was one of only two sectors that posted gains, soaring 65% while the broader S&P 500 plunged.
Lee, Lee, and Coldiron devote most of “The Rise of Carry” to analyzing the present market cycle, only briefly touching on past regimes. Yet our research indicates that previous periods of extreme commodity undervaluation-the late 1920s, the 1960s, and the 1990s-were all accompanied by major carry bubbles. The historical pattern is clear: each era of financial excess, driven by leverage and suppressed volatility, has eventually met its reckoning, and each reckoning has marked the turning point for commodities.
We identified four distinct carry regimes, each followed by a severe unwind. The first unfolded between January 1927 and August 1929, ending in the brutal downturn that lasted until June 1932. The second began in July 1962 and persisted until November 1968, with its unwind extending until September 1974. The third emerged in November 1990, lasting through August 2000, before collapsing in a selloff that dragged on until September 2002. The most recent carry regime commenced in March 2009 and remains ongoing. Looking back over nearly a century of market history, we found that carry regimes have dominated 35% of the time, unwinds 11%, and non-carry markets-the periods in between-accounted for the remaining 54%.
A striking pattern emerged: prior carry regimes bore a strong resemblance to today’s market dynamics.
On average, the S&P 500 delivered superior returns during carry regimes, rising 1.4% per month compared with 0.8% during non-carry periods. However, unwinds were brutal, with the index falling an average of 2% per month.
Value investing, traditionally a stalwart over long time horizons, saw its edge shrink considerably in carry regimes. According to Professor French’s historical dataset, the value factor outperformed by 43 basis points per month during non-carry periods but by a mere 8 basis points per month during carry regimes. When carry trades unwound, value significantly outperformed, as high-multiple growth stocks collapsed.
The same trend held for small-cap equities. They outperformed by 31 basis points per month in non-carry periods but saw that advantage shrink to just 11 basis points during carry regimes. When unwinds struck, small-cap stocks underperformed by 21 basis points per month, likely due to a wave of bankruptcies among the most leveraged firms.
Yields consistently compressed during past carry regimes. The average spread between equity earnings yields and Treasury rates fell to just 2.4%, compared with 6.0% in non-carry periods, as investors bid up asset prices while risk premiums eroded.
Momentum, by contrast, flourished in carry regimes. It returned 1.27% per month during these periods, compared with only 0.48% in non-carry environments, as capital continued chasing prior winners.
Hyper-financialization was another hallmark of carry regimes. U.S. equity market capitalization surged to an average of 120% of GDP during these periods, compared with just 58% in non-carry environments.
Volatility suppression was widespread. Large drawdowns of greater than 10% in the S&P 500 were milder and recovered more quickly during carry regimes, averaging a 17% decline with a rebound in 339 days. By contrast, non-carry periods saw an average drawdown of 25%, requiring 817 days for recovery.
Most notably, every past carry regime culminated in a massive mispricing of risk, followed by a violent unwind that inflicted deep losses on investors. And in every instance, the cycle’s collapse coincided with the start of a period of sustained natural resource outperformance, lasting years.
Carry regimes have a way of sustaining themselves-until they don’t. They function like a well-oiled machine, running smoothly and predictably, drawing in ever more capital, reinforcing the same trades, and compounding imbalances. The cycle builds upon itself, accelerating distortions until the sheer weight of misallocation begins to strain the very infrastructure of the global financial system. At some point, the pressure becomes too great, and the system is forced into a dramatic shift. This moment-the breaking point-marks the beginning of the carry unwind.
Carry regimes thrive on continuity. As long as tomorrow looks like today, the trade holds, leverage builds, and returns accumulate. But when the global monetary order shifts, tomorrow looks radically different. Suddenly, the foundation that supported years of steady, low-volatility gains crumbles, forcing a violent unwinding of leveraged positions.
History has made this pattern clear. Every prior carry unwind has aligned with a fundamental transformation in the monetary system. The collapse of the classical gold standard in 1929, the unraveling of Bretton Woods in 1968, and the forced realignment of emerging market currency pegs in 1998 all served as catalysts. Each marked the end of an era of artificial stability-and the beginning of a carry unwind.
Recent remarks from President Trump, Treasury Secretary Bessent, and Miran suggest that we may be nearing another such moment of reckoning. Each has, in their own way, pointed to the mounting distortions in the current monetary system and the growing imbalances that threaten its stability. Bessent, in particular, has been explicit about the need to address the financial system’s underlying “plumbing” as a means of restoring equilibrium-an acknowledgment that the present framework is not merely strained but unsustainable.
Taken together, these signals leave little doubt: a significant shift in the global monetary order is not only possible but increasingly at the forefront of the administration’s agenda. The precise form this change will take remains uncertain, but history tells us that when policymakers begin openly questioning the status quo, the status quo is already on borrowed time.
Gough still in its early stages, the rumored framework for what the media has dubbed the Mar-a-Lago Accords is beginning to take shape. Based on comments from Treasury Secretary Bessent, the emerging plan appears to center on reorganizing global trade and financial relationships into distinct tiers, with countries sorted according to their currency policies, trade agreements, and security alliances. Under this system, nations deemed “friendly” would enjoy tariff-free access to the U.S. market and broad access to U.S. dollar liquidity lines. Tariffs, rather than being strictly punitive, would function as a form of economic demarcation-determining whether a given country is inside the bloc, on its periphery, or entirely outside.
Another key component of the rumored plan involves restructuring U.S. Treasury debt. Gere has been speculation about issuing 50-year nonmarketable Treasury bonds, which would not trade freely but could be sold back to the U.S. government or pledged as collateral-presumably at par-against repo loans in times of financial distress. It is not difficult to imagine that participation in this system could eventually become a prerequisite for inclusion in the new trading bloc itself.
Perhaps the most consequential element under discussion is the potential revaluation of the Federal Reserve’s gold holdings. Owing to legislation dating back to President Roosevelt’s gold confiscation order, the Fed was compelled in 1934 to surrender its gold to the Treasury in exchange for a paper IOU. This asset has remained on the Fed’s balance sheet at a fixed price of $42 per ounce since 1973-a stark contrast to gold’s current market price of $2,900 per ounce. With a simple majority in Congress, the Federal Reserve could revalue these holdings, instantly increasing its balance sheet assets by roughly $800 billion. This unrealized capital gain would flow to the Fed’s equity account-better known as the Treasury General Account-creating an immediate $800 billion liquidity injection without requiring commercial bank intermediation. Such a maneuver could also serve to offset the dollar strength that might accompany the widespread imposition of tariffs.
Though still speculative, the outlines of this proposed regime suggest a dramatic reordering of the global financial and trade system-one that would mark the most significant shift in U.S. monetary policy since the closure of the gold window in 1971.
Each of these proposed measures is designed to do one thing: reassert the dollar’s dominance as the undisputed global reserve currency. While the BRIC nations have been steadily pushing for de-dollarization, Bessent appears to be pursuing something far more ambitious-a sweeping “re-dollarization” that seeks to re-anchor the global financial system around the U.S. currency with an entirely new set of incentives.
Whether the administration’s efforts will succeed is impossible to say. But within our framework, the success or failure of any individual policy may be beside the point. What is certain is that the Mar-a-Lago Accords represent the most significant proposed shift in the global monetary system since the original Bretton Woods agreement in 1945. Bessent and Miran are speaking about the world’s financial “plumbing” in terms more radical than anything heard in decades, signaling that a major break from the status quo is being actively considered at the highest levels.
The world appears to be racing toward a fundamental shift in both the global monetary system and the geopolitical order. This is exactly the kind of moment that Neil Howe’s Fourth Turning framework would predict: a period of deep institutional upheaval that reshapes economic and political structures. For investors operating within the carry regime, the message is clear-tomorrow is unlikely to resemble yesterday. These are the moments in history that have coincided with the unwinding of massive financial imbalances. They are also the moments that have preceded long cycles of commodity and natural resource outperformance.
When will tomorrow arrive? If our intuition is correct, the administration is operating under severe time constraints. They likely need to clarify their plans by summer-before the political calendar takes over and the 2026 midterm elections begin to dominate the national conversation. Gat gives them weeks-maybe months-to set the stage.
For the first time since we began analyzing commodity cycles, a major catalyst appears to be emerging in the near term.
History tells us that these transitions-every one of them-have been marked by a devaluation of the dollar relative to gold. And if gold is the canary in the coal mine, it is singing loudly. The metal has surged 35% year over year and is already up 11% year-to-date. Perhaps, in its quiet and unambiguous way, gold is signaling that we are fast approaching the turning point.
Investors would do well to take notice. The assets that thrived under the carry regime are unlikely to perform in the next phase. True diversification-real diversification-will be essential. Natural resource equities, after a strong three-year run, have been mixed in recent months. But if history is any guide, this may be the final great buying opportunity before the carry regime unravels and commodities enter their next era of outperformance.
4th Quarter Natural Resource Market Summary
Commodities delivered a mixed performance in the fourth quarter, navigating a confluence of macroeconomic pressures. Continued weak economic data from China, the election of Donald Trump, and the resulting surge in the U.S. dollar created a significant headwind for many raw materials. Oil and natural gas-both in North America and globally-showed resilience, while base metals and precious metals struggled under the weight of dollar strength. The grain complex remained weak as well.
Against this backdrop, commodity indices posted modest gains, largely driven by energy prices. The Goldman Sachs Commodity Index, supported by firming oil and U.S. natural gas prices, edged up just over 3%. Meanwhile, the Rodgers International Commodity Index, with its heavier weighting in metals and agricultural commodities, managed a smaller gain of under 1%.
Natural resource equities fared worse, suffering pronounced declines. The S&P North American Natural Resource Sector Index, heavily weighted toward oil and gas, slid 2.3%. The S&P Global Natural Resource Index, which carries a greater concentration in metals and agricultural equities, fell more sharply-down over 11% for the quarter.
Meanwhile, in stark contrast, the S&P 500 continued its upward march, gaining 2.5%-a move largely fueled by its heavy exposure to mega-cap technology stocks. The market’s prevailing regime remained intact: capital continued to flow into high-growth names, while tangible assets and resource equities remained under pressure.
Oil
After a sharp 15% decline in the third quarter, oil mounted a subdued recovery in the fourth. Both West Texas Intermediate and Brent crude rose by approximately 5%, though the rally lacked the conviction seen in past rebounds. By year’s end, oil prices had essentially gone nowhere, finishing almost exactly where they started-at $73 per barrel.
Oil-related equities delivered a similarly mixed performance. The XLE ETF, which tracks large-cap integrated energy companies, declined 1.6%, while the XOP ETF, representing exploration and production stocks, eked out a modest 1.3% gain. However, the real laggard remained the oil services sector, where investor skepticism over upstream capital spending persisted. Oil service stocks extended their underperformance, falling another 2.4% during the quarter-underscoring the prevailing uncertainty around future drilling activity.
Despite oil’s fourth-quarter rebound, a deep sense of pessimism continues to weigh on global oil markets. The latest Oil Market Report from the International Energy Agency (IEA) reinforced this gloom, warning yet again that global supply will outstrip demand, inventories will swell, and prices will retreat in 2025. According to the IEA, the coming year will mark just the beginning of a prolonged period of upheaval in oil markets, with surplus production capacity reaching unprecedented levels by the decade’s end.
By 2030, the agency forecasts that global oil demand will reach only 105.4 million barrels per day-barely 1.5 million barrels per day above current levels. Meanwhile, supply is expected to surge to nearly 114 million barrels per day. The implications, if accurate, are severe. Such a surplus would challenge OPEC’s ability to manage prices and could trigger a period of extreme market volatility. “Reduced requirements for OPEC crude may put the alliance’s market management to the test,” the IEA cautions.
Given the weight the IEA’s projections carry among investors and policymakers, it’s little wonder that sentiment in global oil markets has reached near-unprecedented levels of pessimism.
We, however, continue to firmly disagree with the IEA’s projections. Much of their demand forecast hinges on aggressive electric vehicle (‘EV’) adoption rates-assumptions we believe to be wildly optimistic. Recent disappointments in projected EV sales only reinforce our conviction that the industry is struggling to meet expectations and that penetration rates will remain far lower than the IEA anticipates.
Furthermore, the IEA has a well-documented track record of underestimating oil demand, particularly in the non-OECD world, which now accounts for 55% of total global consumption. Over the past 15 years, the agency has significantly undercounted demand growth in 13 of those years-missing the mark by nearly 1 million barrels per day annually. We see no reason to believe this pattern will change. If anything, we expect their demand underestimation to persist, further weakening the credibility of their long-term outlook.
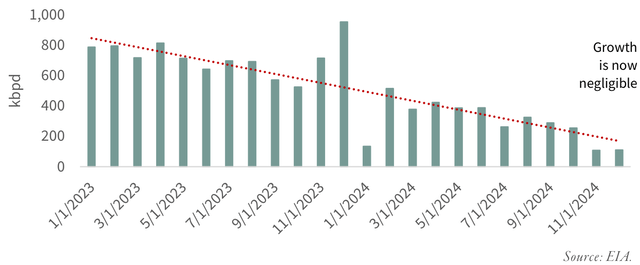
On the supply side, we believe the IEA is making an equally large miscalculation. Their forecast assumes substantial non-OPEC production growth, yet nearly 90% of non-OPEC supply gains since 2010 have come from U.S. shale. And here, the data tells a different story. According to the U.S. Energy Information Administration (EIA), even the most prolific shale basins, including the Permian, have either plateaued or begun to decline. As shown in the chart below, shale oil production growth has consistently slowed over the past two years and is now on the verge of turning negative on a year-over-year basis.
In short, we believe the IEA’s forecast rests on faulty assumptions on both sides of the equation-underestimating demand while overstating supply. If history is any guide, reality will once again diverge sharply from their projections.
FIGURE 2 Year-on-Year Growth in US Shale Oil Production
The impending disappointment in U.S. shale production will have far-reaching and largely unanticipated consequences for global oil markets. While few are discussing it, we believe the world is on the verge of repeating the events of 2003 to 2008-a period that saw a dramatic realignment in supply, demand, and pricing power.
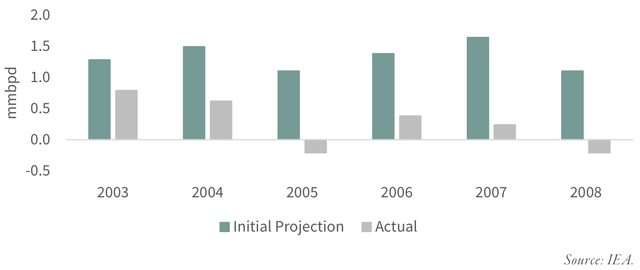
During that earlier cycle, the market was caught off guard by a significant shortfall in non-OPEC supply growth. As clearly illustrated in the chart below (courtesy of Mike Rothman at Cornerstone Analytics), the inability of non-OPEC producers to meet expected output levels allowed OPEC to regain both market share and pricing control. The result was a historic bull run in oil prices: crude ended 2002 at just $30 per barrel, yet by June 2008, prices had surged nearly fivefold, briefly touching $145 per barrel.
The conditions today bear a striking resemblance to that earlier period. As shale production falters, the market’s assumptions about supply growth will be forced to adjust-just as they did two decades ago. The implications for oil prices could be profound.
During the 2003-2008 period, the supply-side shock that caught markets off guard was driven by the unexpected production rollovers of two major fields: the North Sea and Mexico’s massive Cantarell complex. Together, these fields had accounted for nearly 65% of the growth in non-OPEC oil supply between 1995 and 2003. When production at both fields abruptly rolled over, almost no one saw it coming.
FIGURE 3 IEA Estimates vs. Actual Year-on-Year Oil Production Growth
Today, the situation is eerily similar. Since 2020, U.S. shale has contributed nearly 90% of all non-OPEC supply growth. But just as the North Sea and Cantarell fields succumbed to depletion, so too are the U.S. shales now facing the inescapable realities of the Hubbert Curve. The forces at work then are at work now, and they are beginning to manifest clearly in shale production profiles. As non-OPEC supply slows, OPEC will reclaim market share and pricing power-power they will undoubtedly use.
And then there’s the issue of just how cheap oil has become.
By historical standards, oil today is extraordinarily undervalued. We have tracked the long-term gold-to-oil ratio going back to 1858, and the average relationship over that span has been remarkably stable: one ounce of gold has historically purchased about 20 barrels of oil. At present, however, an ounce of gold buys 43 barrels-putting oil at one of its cheapest levels relative to gold in more than a century and a half.
Only three times in our dataset has oil been this inexpensive relative to gold. The first came in early 2016, as the OPEC-led price war was winding down, when the ratio briefly hit 47. The second occurred in the aftermath of the COVID market collapse-excluding the anomalous April 20, 2020, event when oil prices momentarily turned negative, we use Brent at $20 per barrel, which still pushed the ratio to 85. The third instance came at the end of 2020, when the ratio topped out at 53.
Each of those moments presented investors with enormous opportunities in energy-related securities. We believe a similar opportunity is now unfolding once again.
Natural Gas
Natural gas prices continued their upward momentum in the fourth quarter, adding another 24% gain to an already strong rally. For the year, U.S. natural gas emerged as one of the best-performing commodities, climbing an impressive 45%. The strength in natural gas was not limited to the U.S.-international markets also posted significant gains. On the European continent, natural gas prices rose 27% in the fourth quarter, closing the year up 20%. In Asia, prices climbed 15% in the fourth quarter and ended the year more than 30% higher.
Equities with significant exposure to natural gas markets followed suit. The FCG ETF, which tracks companies involved in the natural gas industry, rose 4.2% for the quarter.
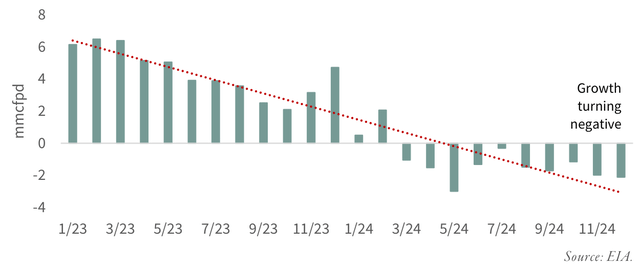
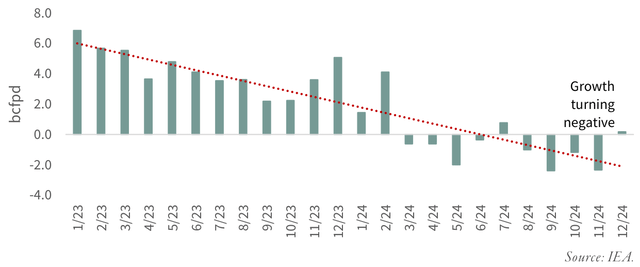
But the real story is unfolding beneath the surface. The same forces now tightening supply in U.S. oil shales are aggressively at work in U.S. gas shales as well. For years, we have chronicled these structural pressures-the inevitable geological and financial constraints that would eventually assert themselves. And now, as the chart below illustrates, that moment has arrived. Year-over-year growth in U.S. gas shales has officially turned negative. The implications for supply, pricing power, and market structure are only just beginning to take shape.
FIGURE 4 Year-on-Year Change in US Shale Dry Gas Production
Since shale gas production has accounted for well over 100% of total U.S. natural gas production growth over the past 15 years, it follows that as shale output declines, total U.S. dry gas production should also turn negative. As the chart below clearly illustrates, that inflection point is now at hand.
For years, the relentless expansion of shale gas-driven by aggressive drilling, technological advancements, and an abundance of cheap capital-masked the underlying depletion dynamics at work. But the forces we have long warned about are now asserting themselves. The rapid production growth that defined the past decade is fading, and with year-over-year declines now evident in the shales, total U.S. dry gas production is poised to follow suit.
FIGURE 5 Year-on-Year Change in Total US Dry Gas Production
The implications are profound. With U.S. gas production facing structural headwinds, the pricing dynamics that dominated the past decade are likely to shift. A market long defined by oversupply and low prices may soon find itself grappling with a very different reality.
With production growth now definitively slowing, the stage is set for a significant spike in natural gas prices. The long-standing disconnect between U.S. and international natural gas prices-currently sitting at approximately $16 per MMBtu-appears poised to narrow.
For the past two years, natural gas bears have been rewarded by an extraordinary stroke of luck: two consecutive, near-record warm winters across North America. These unseasonably mild temperatures have dramatically curtailed heating-related demand, masking the underlying tightening of supply.
Following the exceptionally warm 2022-2023 winter, U.S. natural gas inventories swelled, adding nearly 600 Bcf of excess storage relative to the 10-year average. But that inventory cushion did not last. By the end of the 2023 injection season, strong gas demand had worked off most of the surplus, bringing storage levels back toward balance.
A similar pattern repeated in 2023-2024. Another abnormally warm winter once again pushed inventories to near-record levels relative to historical averages. Yet, despite the mild weather, demand remained resilient, and by the start of the 2024-2025 withdrawal season, 70% of the prior year’s excess inventory had already been drawn down.
With production growth stagnating and inventories no longer building at the pace they once did, the market’s ability to absorb even a modest weather-driven demand surge is weakening. The balance that has kept U.S. prices suppressed may soon give way to the kind of volatility and price spikes that have defined global gas markets in recent years.
After an unseasonably warm start, winter conditions in December and January have turned colder than normal, and as a result, natural gas inventories now stand below average. The past two injection seasons began with storage levels at abnormally high levels due to back-to-back warm winters, but unless temperatures turn sharply mild for the remainder of the season, a repeat of that bearish inventory overhang is unlikely.
Meanwhile, demand for natural gas is set to surge in 2025. The commissioning of three new LNG export facilities alone is expected to add nearly 6 Bcf per day of incremental demand. All three projects were originally slated to come online in 2024, but construction delays have now pushed their start dates into 2025.
Against this backdrop-falling supply, the first true normalization of inventories in two years, and a major new source of structural demand-the long-standing disconnect between U.S. and international natural gas prices looks increasingly unsustainable. U.S. prices have lagged global benchmarks for years, but as these forces take hold, the case for convergence strengthens significantly. Given the scale of the supply-demand imbalance forming, the risk is no longer just that U.S. prices catch up to international levels-it is that they could overshoot them at some point in 2025.
Yet, despite all of this, investors remain strangely indifferent to the most direct beneficiaries of a coming natural gas bull market. Gere is now broad recognition that natural gas will play a central role in powering the surge in AI-driven electricity demand. But rather than buying the commodity itself-owning the gas molecule in the ground-speculative money continues to flow into pipelines, utilities, and even gas-fired power generation.
If we are correct, and North America is in the midst of a transition from a long-term structural surplus to a long-term structural deficit in natural gas, these capital allocations could prove deeply misguided. Infrastructure investments that depend on purchasing cheap natural gas could find themselves on the wrong side of a market shift, with rising input costs eroding their economics.
Once it becomes clear that natural gas has become structurally scarce, we believe a scramble will ensue-commercial users and investors alike will realize they must secure control over supply, rather than just access to it. At that point, natural gas production companies, which today trade at deeply discounted valuations, will become the focal point of a bidding war. These stocks remain astonishingly cheap if one is willing to value their reserves at just $6 per Mcf.
Right now, conventional wisdom holds that a sustained bull market in natural gas is impossible. But as the reality of shifting supply fundamentals takes hold, we expect that consensus to unravel. The market is changing-quietly, but decisively. And when recognition comes, it will come quickly.
Copper
Gloom overtook base metal investors in the fourth quarter.
After a strong rally in the third quarter-driven by optimism around China’s newly announced economic stimulus plans-base metals slumped across the board as disappointment set in over the actual impact of those measures. Nickel, still reeling from oversupply and sluggish EV battery demand, led the decline, tumbling nearly 13%. Copper fared little better, erasing its entire third-quarter gain with an 11% drop. Aluminum and zinc also struggled, falling 2.3% and 3.6%, respectively.
Base metal equities followed suit, delivering a punishing quarter for investors. The XBM:CA CN ETF, a broad measure of base metal stocks, dropped 12%, while copper stocks-tracked by the COPX ETF-plunged nearly 20%.
Despite the recent weakness, copper remains our top short-term pick. According to our modeling, global copper markets remain in deficit-a condition that has persisted since 2021. On a monthly basis, copper has been in deficit nearly 75% of the time, a trend that is clearly illustrated in the chart below.
While sentiment remains weak, underlying fundamentals tell a different story.
Confirming our modeling, easily accessible copper inventories-those held on the three major exchanges in London, New York, and Shanghai-began a steady decline in early 2021. Chronic deficits drove inventories lower and lower, culminating in a significant short squeeze on the COMEX exchange in London beginning in April of last year.
Since that squeeze, however, exchange inventories have risen sharply, raising an important question: Has the copper market flipped from deficit to surplus due to weakening Chinese demand, or are traders, having been burned by insufficient inventories last year, now stockpiling copper after previously being too aggressive on the short side?
FIGURE 6 Copper Surplus / Deficit
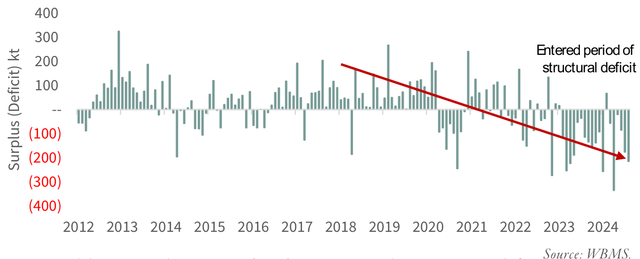
Our modeling strongly suggests that the copper market remains in deficit. If correct, we should soon see a drawdown of the 400,000 tonnes of inventory that accumulated following last year’s COMEX short squeeze. That process now appears to be underway-since peaking in August, exchange inventories have already declined by nearly 200,000 tonnes, providing strong confirmation that copper’s structural deficit remains intact.
Data from the World Bureau of Metal Statistics (WBMS) further supports this view. For the first 11 months of 2024, global copper demand increased by approximately 600,000 tonnes, or 2.5%. As usual, the entire demand increase came from the non-OECD world. China, which saw copper demand surge by more than 12% in 2023, has experienced a slowdown, with demand growth moderating to 2.5% so far this year-right in line with what our modeling predicted and a subject we discussed at length in our last letter.
China’s role in the copper market cannot be overstated. Its 2.5% demand growth in 2024- roughly 400,000 tonnes-accounts for 65% of total global demand growth. Over the past 25 years, analysts have consistently underestimated China’s copper consumption, failing to appreciate the sheer scale of its impact on the market. We have written extensively on this trend for over a decade.
However, our modeling now suggests that this era of perpetual demand surprises to the upside may be coming to an end. After years of overconsumption-driven in part by an unprecedented renewable energy build-out-China may soon become a source of disappointment for copper demand. If we are correct, the market’s longstanding tendency to underestimate Chinese demand may soon reverse, with analysts instead overestimating its future growth potential. This shift could represent a significant headwind for copper as the decade progresses.
Outside of China, copper demand continues to show strong growth across the non-OECD world. Led by gains in Brazil, Indonesia, Malaysia, Saudi Arabia, and Vietnam, non-OECD (ex-China) copper demand grew by a robust 6%-adding over 200,000 tonnes in the first 11 months of 2024. This represents the remaining 35% of global copper demand growth for the year.
On the supply side, the surge in copper mine production that marked the start of 2024 has now run its course. Early in the year, global mine supply grew at an impressive 7% year-over-year, driven largely by mine expansions in the Democratic Republic of Congo (DRC). That wave of new supply has now faded, and by the fourth quarter of 2024, year-over-year growth had slowed to less than 1%. For the first 11 months of 2024, total copper mine supply looks set to increase by just under 2%-or approximately 400,000 tonnes.
With demand growth outpacing supply-600,000 tonnes versus 400,000 tonnes-and little change in scrap availability compared to 2023, the data overwhelmingly points to a persistent deficit in the copper market. Further reinforcing this tightness is the behavior of copper concentrate treatment charges. These charges, which smelters receive for processing raw copper ore, are rumored to have turned negative by the end of 2024-a strong indication that smelters are competing for scarce copper concentrate. Historically, collapsing treatment charges have been a reliable signal of supply constraints in the market.
Looking ahead to 2025, the supply picture remains tight. The only major sources of new production growth will come from the continued ramp-up of Ivanhoe’s Kamoa-Kakula Phase 3 expansion in the DRC, expected to contribute around 150,000 tonnes, and the Oyu Tolgoi mine in Mongolia, operated by Rio Tinto, which should add another 125,000 tonnes. Beyond these two projects, there are no significant supply additions scheduled for 2025.
On the demand side, we expect Chinese copper consumption to slow further next year. However, the broader non-OECD world should continue to see strong demand growth, offsetting much of China’s deceleration. India, in particular, stands out. After a slight contraction in 2024, Indian copper demand is expected to resume its upward trajectory. Between 2018 and 2023, India’s copper consumption surged by 75%, and our models indicate that this trend will continue. Importantly, India is not alone-several other non-OECD nations exhibit copper consumption patterns similar to China’s in the early 2000s, just before its demand exploded.
If history is any guide, we may be standing at the beginning of a new phase in the global copper market-one where the baton of demand growth passes from China to a broader set of emerging economies.
With limited supply growth and strong projected demand from the non-OECD, non-China world, the global copper market is set for yet another year of deficits.
In the near term, we remain bullish on copper prices. Our modeling continues to project persistent supply shortfalls, and we believe this is already being reflected in the drawdown of the short-squeeze-driven inventory build from last year. The fundamentals of tight supply and steady demand remain firmly in place.
However, on a longer-term basis, we remain more cautious. As we outlined in last quarter’s essay, “Copper and Uranium: The Coming Divergence,” we hold strong reservations about the market’s widely accepted assumptions regarding copper demand from the renewable energy sector. We believe these expectations are overly optimistic. If renewable-driven copper demand falls short of projections-particularly when combined with slowing Chinese consumption growth-it could force a major downward revision in long-term demand estimates.
At the same time, we must also reassess long-term supply assumptions. In the first quarter of 2022, we published “Ge Problem With Copper Supply,” where we detailed widespread forecasting errors among copper market analysts that led to chronic overestimation of future mine supply. Since then, the consensus has shifted toward our view-that mine supply will likely fall well short of expectations as the decade progresses.
However, our thinking has evolved as well. In the years since we first published that essay, new exploration methods and copper extraction technologies have emerged that could fundamentally alter the supply equation. These advances may not only enable the discovery of new copper deposits but also dramatically reduce the cost of extracting copper from low-grade sulfide ores-an area long considered uneconomical.
Moreover, a number of extremely large, high-grade copper discoveries have recently been made, challenging the prevailing belief that all the world’s significant copper deposits had already been found using traditional exploration techniques. These developments suggest that the consensus view-that high-quality copper deposits are all but exhausted-may need to be reexamined.
In our next letter, we will take a deeper dive into the future of copper supply and attempt to answer a crucial question: Is it truly impossible to grow global copper mine supply, or are we on the cusp of a technological and exploration-driven shift that could change the trajectory of the industry?
Precious Metals
“London vaults hit by gold shortage….” Financial Times, January 30,2025
The gold market is under immense strain, though few recognize that these stresses are setting the stage for what will ultimately be a historic bull run. Trump’s trade policies are already reshaping both the flow and pricing of gold, a fact increasingly reflected in financial headlines. Gold has been pouring out of London and heading to New York in anticipation of impending tariff and trade policy shifts-an early signal of just how sensitive gold will become to the disruptive economic policies now being shaped by the Trump administration.
We continue to hold a firm conviction that a fundamental shift in global monetary policy is imminent-one that will send gold prices far higher than anyone currently expects. The great gold bull market has begun. Yet, remarkably, it is unfolding with almost no participation from Western investors. This absence of interest offers enterprising investors a rare, generational buying opportunity.
That said, in the short term, precious metals struggled in the fourth quarter. Gold slipped 1%, silver dropped nearly 7%, and platinum and palladium fared even worse, falling 8% and 10%, respectively. The primary culprit?–U.S. dollar strength. The trade-weighted dollar index jumped more than 8% in response to Trump’s reelection, as markets digested the implications of his aggressive tariff policies and stepped-up deportation agenda. The prevailing consensus is that these policies will drive inflation expectations higher, pushing interest rates upward and adding further strength to the dollar.
This conventional wisdom, however, misses the bigger picture. While a stronger dollar may pressure gold in the short term, history suggests that the real driver of gold’s next move will not be exchange rates alone, but a fundamental reordering of global monetary policy-one that is already underway.
The strength of the U.S. dollar also weighed heavily on precious metal equities. The widely followed GDX gold stock ETF plunged 15% during the quarter, while silver stocks, as tracked by the SIL silver equities ETF, declined just over 10%.
Yet while investor sentiment toward gold miners turned sharply negative, central banks continued to buy gold at a torrid pace in the fourth quarter. According to World Bureau of Metal Statistics (WBMS) data, central banks purchased 333 tonnes in the quarter, bringing total 2024 purchases to 1,051 tonnes-the third consecutive year of official-sector buying exceeding 1,000 tonnes.
Among the most aggressive buyers was Poland, which continued its accumulation strategy, purchasing 90 tonnes in 2024. The country has publicly stated its intention to increase gold to 20% of its total international reserves, and following its latest purchases, gold now accounts for 17% of Poland’s reserve holdings.
The Indian central bank also emerged as a significant buyer, acquiring 73 tonnes in 2024- triple the amount purchased in 2023. The Reserve Bank of India has been notably discreet about its gold accumulation strategy, with its governor offering only a vague but telling remark: “We are building up our gold reserves.” India’s position is particularly interesting, as the country could ultimately find itself trading with China in local currencies as part of the BRICS economic bloc, with gold serving as a potential settlement mechanism for currency imbalances.
China also returned to the gold market in the fourth quarter. AGer an extended six-month absence following its last recorded purchase in April, the People’s Bank of China (‘PBOC’) resumed buying in November and December, adding 5 tonnes and 10 tonnes, respectively. For the year, China’s total gold purchases reached 44 tonnes-far below the 231 tonnes it acquired in 2023, but its return as a net accumulator signals that PBOC demand remains intact.
Given the uncertainty that Trump’s reelection has injected into global currency and financial markets, it is no surprise that central bank gold buying accelerated in the fourth quarter. With geopolitical and monetary instability only set to increase, official-sector demand should remain strong in 2025 as central banks seek to further insulate themselves from the risks emerging in the global financial system.
After accumulating nearly 140 tonnes of gold between May and October of last year, Western investors have temporarily lost interest. The surging U.S. dollar and the Federal Reserve’s retreat from its previously telegraphed rate-cut trajectory-citing persistently high inflation-have dampened appetite for gold, at least among ETF investors.
The 18 physical gold ETFs we track have now entered a mild three-month liquidation phase, as shown in the chart below. Silver has followed the same pattern-Western investors who were buyers just months ago have now turned into net sellers. Yet despite this liquidation, gold prices continue to climb, underscoring a crucial shift: the forces driving global gold markets are no longer dictated by Western investors alone.
Since the end of October, these 18 gold ETFs have collectively shed 30 tonnes of gold, and yet the gold price remains 2% higher. The disconnect is telling. Gold is rising even as Western investors sit on the sidelines, a phenomenon that suggests other buyers-whether central banks, emerging market investors, or sovereign wealth funds-are stepping in to absorb supply.
We firmly believe that this pullback in Western investor interest is temporary. As geopolitical and monetary uncertainty intensifies, gold will regain favor. Trump has already called for the Federal Reserve to resume cutting rates, and his aggressive tariff policies are likely to create further monetary disorder-conditions that have historically driven gold demand higher.
Perhaps the most striking sign of Western apathy is in the gold equities market. Despite gold prices climbing relentlessly since their March 2024 breakout-now up 40%-investor interest in gold stocks has only continued to wane. The number of shares outstanding in the GDX ETF, by far the most popular gold mining stock ETF, has contracted by nearly 20% over the same period.
This divergence persists in the short term as well. Since gold’s mid-December low, prices have advanced nearly 10%, yet as clearly shown in the chart below, shares outstanding in GDX have declined another 5%. Investors remain reluctant to allocate capital to mining stocks, even as the fundamental backdrop grows increasingly favorable.
FIGURE 7 Gold Price vs. GDX and Gold ETF Shares Oustanding
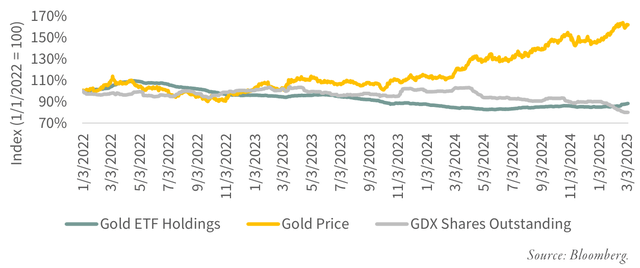
History suggests that such divergences do not persist indefinitely. If gold prices continue their ascent, capital will eventually flow back into gold equities, and when it does, the re-rating could be significant.
Western investors remain firmly fixated on technology stocks, showing little interest in anything else-even as both gold and gold equities have quietly emerged as market leaders in 2025. The disconnect is glaring. The widely followed QQQ ETF, which mirrors the performance of the tech-heavy NASDAQ 100, has eked out just a 2% gain this year. Meanwhile, the GDX gold miners ETF has surged 16%, and gold itself has climbed 8%. Yet, despite this outperformance, QQQ has seen its shares outstanding rise by nearly 3%, as investors continue to pour capital into the most crowded trades while ignoring sectors that are clearly establishing leadership.
Meanwhile, the gold market is undergoing significant stress-stress that, in time, will be recognized as profoundly bullish. Trump’s trade policies are already reshaping both the flow and price of gold, a reality now making its way into financial headlines. Gold is pouring out of London and into New York in anticipation of coming tariff and trade shifts-an early indication that the gold market has entered a period of heightened pressure and disruption.
Demand for gold continues to intensify, and prices are reflecting that demand. And yet, Western investors remain indifferent, fixated instead on chasing overvalued pockets of the market. This lack of participation has created an extraordinary opportunity for enterprising investors willing to recognize what is unfolding.
We do not expect this disinterest to last. Market leadership is shifting, and when Western investors finally take notice, the resulting capital flows could drive an explosive move higher. The gold bull market has begun-it just hasn’t been widely acknowledged yet. But when it is, the revaluation could be swift and dramatic.
Uranium
“South Carolina utility Santee Cooper is seeking bids to restart construction of two reactions at the VC Summer nuclear Stations, as surging electricity demand nationwide rekindles interest in atomic power.” January 22, 2025, Bloomberg
Spot uranium prices continued to drift lower throughout the fourth quarter, starting at $82 per pound and closing at $73-a nearly 10% decline. In contrast, long-term contract prices, which reflect agreements between producers and utility buyers, remained firm, ending the quarter at roughly $81 per pound. The divergence between spot and term prices is telling: while speculative flows drove uranium’s rally in mid-2023, momentum stalled in early 2024, prompting hedge funds and other fast-money traders to unwind their positions over the past nine months. The discount in spot prices relative to term contracts strongly suggests that speculators have now largely exited the market, removing a source of short-term volatility and setting the stage for a more sustainable price floor-a positive development overall.
Yet, while uranium prices softened, the fundamental backdrop for nuclear power remained anything but weak.
The most notable-and most widely misinterpreted-development came at the end of January, when Chinese AI developer DeepSeek announced that its new algorithms could execute complex AI modeling tasks using only a fraction of the energy required by Western competitors. Investors, fixated on the headline implication that AI-driven electricity demand might be far lower than originally expected, panicked. In the days following the announcement, uranium stocks plummeted nearly 11% on average, as markets indiscriminately sold off anything tied to the AI-energy narrative.
For those familiar with technological history, this reaction was deeply flawed.
In our Q3 2023 letter, we introduced Dr. Jevons, or “How I Learned to Stop Worrying and Love Demand,” an essay exploring Jevons’ Paradox-the idea that as a technology becomes more efficient, its overall usage tends to increase at a nonlinear rate. Applied to DeepSeek’s breakthrough, the logical conclusion is not that AI-related energy consumption will decline, but rather that it will skyrocket. If DeepSeek has truly made AI computing 100 times more efficient, Jevons’ Paradox suggests that demand for AI computing will rise by orders of magnitude-potentially by 10,000 times.
After the DeepSeek news, numerous market commentators began debating the paradox’s applicability to AI-a topic we addressed nearly 18 months ago. While the idea may seem counterintuitive, history provides countless examples of Jevons’ Paradox at work. More efficient steam engines led to more, not less, coal consumption. Cheaper semiconductors drove exponential increases in computing power demand. And if AI processing becomes vastly more efficient, it will become vastly more ubiquitous-driving far greater demand for energy, not less.
The knee-jerk selloff in uranium miners, natural gas producers, and nuclear utilities was not just an overreaction-it was a misreading of the core drivers of future energy demand. As Jevons’ Paradox takes hold in the AI industry, energy consumption will surge, not decline. Investors who recognize this now have a significant buying opportunity in the very sectors that will be essential to meeting AI’s growing power needs.
In our last letter, we outlined our conviction that a new investment cycle in nuclear power generation is on the horizon-driven by the adoption of molten sodium reactors. These reactors, which operate at atmospheric pressure, require significantly less steel and cement to construct and eliminate many of the operational risks inherent in traditional high-pressure water-cooled reactors.
Shortly after we wrote that, META made headlines by issuing a Request for Proposal (RFP) to the nuclear energy industry, seeking partnerships to address its rapidly growing power needs in the cleanest and most sustainable way possible. The company’s proposal aims to develop between 1 and 4 gigawatts of new nuclear generating capacity in the United States. Meta has stated its willingness to partner with and invest in nuclear developers that can successfully permit, design, engineer, construct, and operate these plants.
In its December 2, 2024, press release, Meta made its stance clear:
“We believe that nuclear energy can help provide firm, baseload power to support the growing needs of the electric grids that power both our data centers and the communities around them. Meta believes nuclear power will play a pivotal role in the transition to a cleaner, more reliable, and diversified electric grid.”
Meta is not alone. Amazon (AMZN), Google (GOOG,GOOGL), and Microsoft have all announced plans to incorporate nuclear power into their data center energy strategies.
The wave of corporate interest in nuclear energy continued with another major announcement. Oklo (OKLO), a leading developer of molten sodium small modular reactors (SMRs), and Switch, a large data center operator, disclosed they had signed one of the largest corporate power agreements in history. Under the deal, Oklo will deploy 12 gigawatts of its SMR technology to power Switch’s data centers across the United States. Oklo will develop, construct, and operate its Powerhouses-as it calls its SMRs-under a long-term series of power purchase agreements.
Switch CEO Rob Roy underscored the scale and significance of the agreement:
“Our relationship with Oklo underscores our commitment to deploying nuclear power at a transformative scale for our data centers, further enhancing our offering of one of the world’s most advanced data center infrastructures to current and future Switch users.”
These announcements represent a seismic shift in how corporate America views nuclear energy. The demand for AI-driven computing is growing exponentially, and with it, the need for stable, carbon-free baseload power. The world’s largest tech companies are no longer waiting for policymakers to act-they are directly investing in nuclear power to secure their energy future. This marks the beginning of what could be the most important investment cycle in nuclear energy since the mid-20th century.
And finally, yet another major announcement-one that could significantly impact the future of nuclear power-came from Santee Cooper, the South Carolina utility.
In a January 22, 2025 press release, Santee Cooper announced it was seeking to restart construction on two long-abandoned reactors, VC Summer Nuclear Units #2 and #3. Citing surging electricity demand and a renewed interest in nuclear power, the utility revealed that it was actively looking for buyers to take over and complete the two unfinished reactors.
Santee Cooper’s CEO, Jimmy Stanton, put it plainly:
“We are seeing renewed interest in nuclear energy, fueled by advanced manufacturing investments, AI-driven data center demand, and the tech industry’s zero-carbon targets.”
The history of the VC Summer project is well known. When final construction permits were issued in 2008, the cost to build both reactors was estimated at $9.8 billion. The reactors, both Westinghouse AP1000 designs, officially broke ground in 2013. However, the project quickly became plagued by delays and massive cost overruns. By 2017, estimated completion costs had ballooned to over $20 billion, ultimately forcing Westinghouse into bankruptcy. That July, SCANA and Santee Cooper announced the complete shutdown of construction, declaring the plants “abandoned.” At the time, Unit #2 was estimated to be nearly 50% complete, while Unit #3 remained in an earlier phase of construction.
Now, nearly a decade later, the project appears to have a second chance. While it remains unclear who the buyers will be, the fact that Santee Cooper has made the decision to actively pursue a sale suggests that serious interest exists. If a buyer emerges, it would be another powerful signal that a new investment cycle in nuclear energy is not just beginning-it is accelerating.
The steady stream of positive developments for the nuclear industry shows no signs of slowing. From major corporate commitments to small modular reactor (‘SMR’) investments, to the potential revival of large-scale conventional reactors, the momentum is unmistakable. The long-dormant nuclear renaissance is now underway, and with it, a major structural shift in uranium demand.
The good news just keeps coming.
Agriculture
Agricultural markets, which had been trending downward for most of 2024, delivered a mixed performance in the fourth quarter. Corn prices rallied 8%, driven by a sharp downward revision in U.S. corn yield estimates by the USDA. Meanwhile, soybean and wheat prices continued their declines, each falling nearly 6%. Fertilizer prices also saw divergence-urea, the solid form of nitrogen, firmed 7%, while phosphate and potash prices slipped 2% and 6%, respectively.
We believe agricultural markets are now at a major turning point.
In our Q2 letter, we warned that global grain markets remained under pressure and that prices had further to fall. At the time, the USDA was projecting 2025 ending stocks of 2.1 billion bushels for corn and 435 million bushels for soybeans-levels that implied further downside. Based on historical price-to-inventory relationships, we predicted that corn could drop as low as $3.75 per bushel and soybeans below $10 per bushel. And this is exactly what happened-by August, corn had bottomed at $3.60, and soybeans had hit $9.45 per bushel.
At those lows, sentiment among speculative traders turned overwhelmingly bearish. Twice in 2024-first in February, then again in August-net speculative short positions in both corn and soybeans hit 40-year highs. Two years of declining prices had created an extreme in negative sentiment not seen before in global grain markets.
However, commercial traders-the “smart money” who actually use the grain-were positioned in stark contrast. As speculative traders piled into shorts, commercial traders turned net long in record amounts, marking the most aggressive bullish positioning in 30 years. This divergence-excessive bearishness among momentum-driven speculators against a historic long position among fundamentally driven commercial traders-signaled that a major bottom was forming.
Since that sentiment extreme last summer, corn and soybean prices have rebounded strongly- corn is up nearly 40%, and soybeans have risen 15%.
What fueled this rally? And more importantly, what were commercial traders seeing that speculators missed?
It turns out the USDA had been significantly overestimating 2024 U.S. corn and soybean yields. As recently as October, the USDA’s September WASDE report projected arecord highh U.S. corn yield of 183.8 bushels per acre, which, combined with demand estimates, implied 2025 ending stocks of 2.1 billion bushels-one of the highest in 25 years. This forecast created the illusion of excess supply and weighed on prices.
However, in its January WASDE report, the USDA made a dramatic revision, slashing its corn yield estimate to 179.3 bushels per acre-a 4.5 bushel per acre drop from its October projection.
This revision, along with an upward adjustment in demand estimates, led to a significant recalibration of 2025 ending stocks, which plunged from 2.1 billion bushels to 1.5 billion-a 600 million bushel reduction in just a few months. Adjusted for usage, corn ending stocks have now flipped from decisively bearish to a position in the bottom 25% of historical inventory ranges-a bullish setup.
What was once a market weighed down by perceived oversupply has now, in the span of a few months, transitioned into a much tighter environment. This shift underscores just how quickly sentiment and pricing can change when fundamental assumptions prove incorrect.
The USDA also significantly overstated soybean yields. As recently as October, it projected a record U.S. soybean yield of 53.1 bushels per acre. Based on this overly optimistic assumption, the agency estimated 2025 ending stock inventories at 550 million bushels-a level surpassed only twice in the past 25 years, in 2006 and 2018.
However, as with corn, the USDA dramatically revised its estimates in the January WASDE report, cutting projected soybean yields to 50.1 bushels per acre-a decline of more than 3 bushels per acre. This forced a sharp downward revision in projected 2025 ending stocks, slashing them by over 30% to 380 million bushels. Adjusted for usage, what had once been a top-25% stock level-a decisively bearish indicator-has now dropped to the lower end of the historical range, a far less bearish position.
With ending stocks now running much tighter than anticipated, the 2025 North American growing season has suddenly become critical.
In previous letters, we have written extensively about how weather conditions in North America could become increasingly challenging starting with this planting cycle. Our concern is rooted in historical patterns-specifically, the Gleissberg Cycle, an 88-year sunspot cycle that we believe played a significant role in triggering the Dust Bowl of the 1930s.
Although the causes of the Dust Bowl remain debated, we are strong believers that cyclical solar activity contributed to the extreme drought that gripped the central United States, producing one of the defining environmental and economic crises of the Great Depression. If this cycle repeats-as historical precedent suggests-it could set the stage for a similarly severe drought event in the 2025 growing season.
Warning signs have already emerged.
For the past several years, unusually dry conditions have taken hold in the central United States. In our Q3 2023 letter, we presented a soil moisture chart that showed alarming dryness across key grain-growing regions. However, in both 2023 and 2024, well-timed late-season rains narrowly prevented catastrophic yield losses. The 2024 growing season began extremely dry, and while August rains helped stabilize the crop, the USDA still significantly underestimated the full impact of dry conditions on yields-a subject we just covered in detail.
Now, in early 2025, dry conditions have once again emerged across large portions of the Upper Midwest and the Eastern U.S. The critical question: Will these dry conditions persist and intensify into the planting season?
At this point, we don’t know. But it is something we are monitoring closely.
FIGURE 8a Lower 48 Drought Indicator
Source: NASA.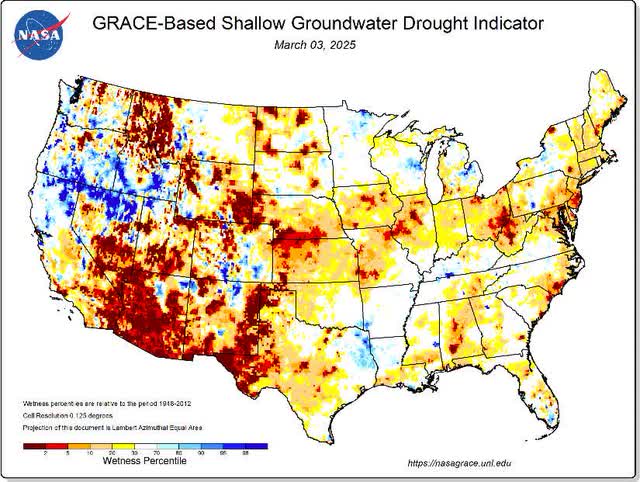
Skeptics might argue that we have seen only limited evidence of Gleissberg-related climate impacts in North America so far. However, the same cannot be said for the rest of the world.
FIGURE 8b South American Drought Indicator
Source: NASA.
Extreme drought conditions continue to grip vast grain-growing regions of Brazil, Argentina, Ukraine, and western Russia. These regions collectively account for a significant share of global grain exports. If widespread drought conditions persist in 2025-especially if they begin to take hold in North America-the global grain market could experience a major supply shock, completely shiGing the pricing dynamics that have dominated the past two years.
FIGURE 8c European Drought Indicator
Source: NASA.
For now, agricultural markets remain in transition. But if the Gleissberg Cycle exerts its expected influence, that transition could accelerate rapidly.
The key conditions necessary for a Gleissberg-driven weather disruption on a global scale have now fallen into place. With global grain inventories having declined sharply since the end of 2024, and with 2025 crop yields at risk of significant reductions should Gleissberg-related drought conditions emerge, we believe that grain prices could enter a major bull market this year.
Since their peaks following Russia’s invasion of Ukraine in early 2022, grain prices, fertilizer prices, and related equities have all declined by at least 50%. This prolonged correction has reset valuations across the agricultural sector, creating a setup where even a modest shift in fundamentals could drive an outsized market response.
Furthermore, the record bearish sentiment in corn and soybean speculative positioning throughout 2024 strongly suggests that a major cyclical low has already been established in global agricultural markets. As we’ve noted, speculative traders piled into extreme net-short positions, while commercial traders-the so-called “smart money”-moved aggressively long. Historically, such extremes in sentiment mark key turning points.
Given these dynamics, we highly recommend that investors take advantage of both the still-depressed sentiment and the deeply undervalued equity valuations across the agricultural complex.
With supply-side risks mounting, weather uncertainty rising, and inventories tightening, the setup for a major agricultural bull market is now firmly in place.
Coal
Coal markets were remarkably quiet in the fourth quarter, with little volatility in U.S. prices. Powder River Basin prices edged up 2%, Central Appalachian coal gained 2.3%, and Illinois Basin prices remained flat. Internationally, thermal coal prices drifted lower, with Australian Newcastle coal slipping 10% and South African Richards Bay thermal prices down 5%. Hard coking coal, which had been trending lower throughout the year on fears of weakening Chinese steel demand, was unchanged in the fourth quarter. Coal equities reflected this lack of momentum, with the Dow Jones/Wilshire U.S. Coal Index flat for the quarter.
Yet, behind this apparent stagnation, global coal demand continues its relentless march higher-despite near-total investor disinterest.
The International Energy Agency (IEA), in its year-end 2024 report “Coal 2024: Analysis and Forecast to 2027,” presents a strikingly bullish outlook. While acknowledging a temporary demand dip during COVID, the agency concedes that coal markets have rebounded with record-high production, consumption, trade, and coal-fired power generation in recent years. Driven by rising natural gas prices in the aftermath of Russia’s invasion of Ukraine, coal’s resurgence has been stronger than expected.
According to the IEA, 2024 growth in China (+56 million tonnes, or 1%) and India (+70 million tonnes, or 6%) more than offset declines in Europe and the U.S. The agency now projects global coal consumption to peak in 2027, citing expectations that China’s massive expansion in renewables will curb coal demand, while OECD coal consumption continues its decline.
We, however, remain skeptical of this assumption.
China’s aggressive investments in renewables and electric vehicles (EVs) are not being driven by climate concerns, despite the media narrative that portrays them as part of a grand decarbonization effort. Instead, China’s renewable push is primarily aimed at reducing its dependence on imported oil, which now approaches 12 million barrels per day. Yet, as we have repeatedly emphasized, large-scale renewable adoption destabilizes power grids and raises generation costs-a lesson now becoming painfully clear in Germany and the UK.
China understands this reality, and its response has been decisive: building more baseload power generation-primarily coal.
Analysts have been taken aback by the sheer volume of new coal-fired power plants announced over the past two years. Many believe this surge is about to end. We disagree. Given renewables’ inherently lower energy efficiency and China’s determination to maintain cheap, abundant electricity to fuel economic growth, we believe that China’s coal demand may not peak until the early 2030s, not 2027 as the IEA suggests.
Meanwhile, global demand for coal continues to rise, just as a new natural gas crisis may be emerging.
For the past 15 years, U.S. shale gas production has been a stabilizing force in global natural gas markets, supplying vast quantities of low-cost fuel. But with U.S. shale growth now coming to a halt, the balance that has kept gas prices in check may be breaking down. A global supply squeeze in natural gas could trigger a fresh wave of coal demand, particularly in Asia, where coal remains the go-to backup fuel.
Even Bloomberg, long a critic of fossil fuels, now acknowledges the tightening coal market. In a March 1, 2025, article titled “Coal’s Four-Year Lows Hide a Coming Global Supply Squeeze,” Bloomberg highlights the looming supply crunch:
“Investments in new production have dwindled in much of the world as shareholders and banks increasingly refuse to approve new spending on projects. Demand, however, continues to rise in India and China, outpacing breakneck rates of expansion in solar and wind, while even developed countries look to coal to help power the artificial intelligence boom.”
Despite coal’s undeniable role in the global energy mix, investors remain overwhelmingly hostile toward the sector.
This aversion is shortsighted. As we have written many times, coal equities have led every commodity bull market for the past 120 years. The pattern appears to be repeating-coal equities have outperformed every other natural resource sector over the past four years. Geir lack of performance over the last 12 months presents investors with another opportunity to accumulate coal stocks at extremely cheap valuations.
In an environment where demand is rising, supply investment is collapsing, and alternative energy sources remain unreliable, the stage is set for a major bull market in coal. The market may not yet recognize it-but history suggests that those who do will be well rewarded.
|
Registration with the SEC should not be construed as an endorsement or an indicator of investment skill, acumen or experience. Investments in securities are not insured, protected or guaranteed and may result in loss of income and/or principal. Historical performance is not indicative of any specific investment or future results. Investment process, strategies, philosophies, portfolio composition and allocations, security selection criteria and other parameters are current as of the date indicated and are subject to change without prior notice. This communication is distributed for informational purposes, and it is not to be construed as an offer, solicitation, recommendation, or endorsement of any particular security, products, or services. Nothing in this communication is intended to be or should be construed as individualized investment advice. All content is of a general nature and solely for educational, informational and illustrative purposes. This communication may include opinions and forward-looking statements. All statements other than statements of historical fact are opinions and/or forward-looking statements (including words such as “believe,” “estimate,” “anticipate,” “may,” “will,” “should,” and “expect”). Although we believe that the beliefs and expectations reflected in such forward-looking statements are reasonable, we can give no assurance that such beliefs and expectations will prove to be correct. Various factors could cause actual results or performance to differ materially from those discussed in such forward-looking statements. All expressions of opinion are subject to change. You are cautioned not to place undue reliance on these forward-looking statements. Any dated information is published as of its date only. Dated and forward-looking statements speak only as of the date on which they are made. We undertake no obligation to update publicly or revise any dated or forward-looking statements. Any references to outside data, opinions or content are listed for informational purposes only and have not been independently verified for accuracy by the Adviser. Third-party views, opinions or forecasts do not necessarily reflect those of the Adviser or its employees. Unless stated otherwise, any mention of specific securities or investments is for illustrative purposes only. Adviser’s clients may or may not hold the securities discussed in their portfolios. Adviser makes no representations that any of the securities discussed have been or will be profitable. Past performance is not a guarantee of future results. |
Original Post
Editor’s Note: The summary bullets for this article were chosen by Seeking Alpha editors.
Read the full article here


")
")