The residential real estate industry has undergone significant changes as a result of economic shifts, industry-specific activity, and consumer behavior. We believe there is a disconnect between the market’s perception of the asset class and forward fundamentals. Specifically, the publicly traded REITs are priced for the presently tepid earnings growth rates, while we see an inflection point ahead.
The inflection point
There is often discussion of a housing shortage in the United States, but rarely discussion on the pathway by which free market forces can correct it. The key piece of data underlying the shortage is a high cost of construction and the way that interacts with microeconomic forces to drive up rental rates over time.
Based on supply and demand data, which we explore more thoroughly below, we believe housing is structurally undersupplied while the high cost of construction economically prohibits sufficient supply from being delivered at a sufficient level. Consequently, net operating income (NOI) growth will be driven by basic economic mechanisms.
Specifically, undersupply will put upward pressure on residential NOI until such a point that it becomes viable to develop enough units. Current rental rates and sales prices do not support sufficient unit growth to keep up with demand growth, such that the sector will be increasingly undersupplied until higher rental rates and sales prices incentivize development.
We shall begin with the hard data showing that new supply of residential real estate has declined materially, and then move on to the macro and microeconomic forces that have reduced supply.
Construction drop-off in 2023 and 2024
2021 was a different time. Interest rates were near zero and money flowed extensively into real estate companies, causing the cost of both equity and debt to be quite cheap. With low weighted average cost of capital (WACC), the hurdle rate for development viability was easy to overcome. As a result, developers of each type of housing ramped up activity
- Homebuilders built the highest number of new homes since before the Financial Crisis in 2008
FRED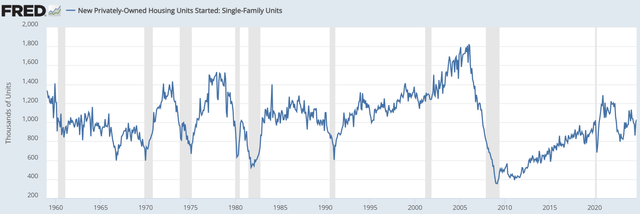
- Apartment developers got ambitious.
Yardi Matrix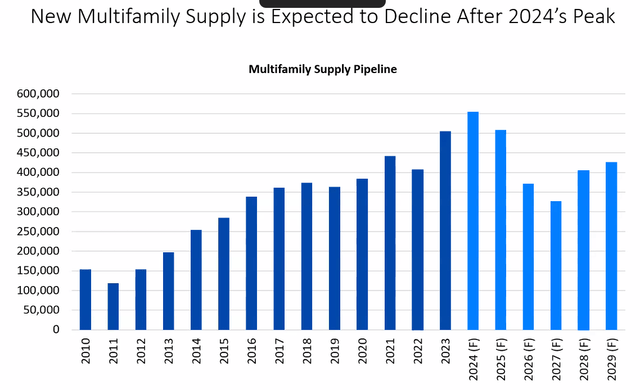
Note that apartments take 2 to 4 years from underwriting to completion, so the heavy level of deliveries slated for 2024 and 2025 were mostly started in 2021-2022. The drop-off in new supply in 2026 and 2027 reflects the low current level of starts.
The National Association of Home Builders sums up total housing supply quite nicely in the table below.
NAHB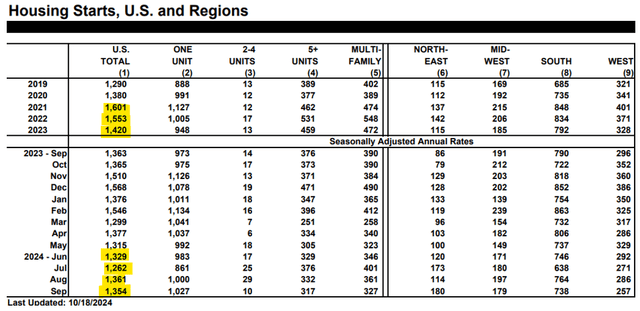
Overall housing starts were a seasonally adjusted annual rate of 1.6 million in 2021, dropping to 1.4 million in 2023. Activity is further dropping to ~1.3 million in 2024 as highlighted in the table.
Not included in the NAHB data are manufactured housing starts. However, NIMBY zoning and regulations have largely halted MH supply for the last 2 decades, making MH impact on overall housing supply just a drop in the bucket.
FRED
A drop in overall housing starts from 1.6 million to 1.3 million may not seem all that major, but that is just the revenue line. It does not account for attrition from obsolescence and demolitions.
New Supply versus Net Supply
Overall housing inventory in the United States sits at about 146 million units.
FRED
Homes last a long time, but not forever. Some percentage of inventory gets demolished each year. Consider a 150-year-old home that gets demolished with a new home built in its place. That new home would be included in the housing starts figure, but it isn’t really net new supply. It is still just one housing unit on that same piece of land.
Thus, the 1.3 million new supply pace in 2024 is not net supply.
How much supply attrition is there?
Well, there isn’t great data on this, but we can infer rough numbers from age of inventory. Housing stock has been getting older, likely due to some combination of replacement becoming expensive and the use of more durable materials and better construction techniques.
As of the latest data, we could find, median home age is 40 years.
NAHB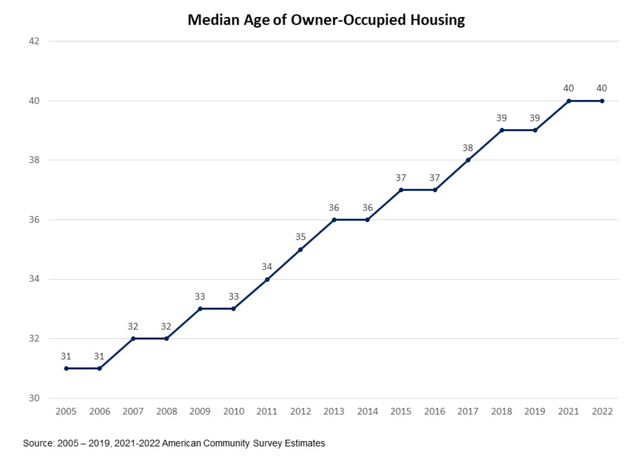
The Mean is a bit older than the Median, with significant skewing of a fat tail on the older side of the housing age bell curve.
NAHB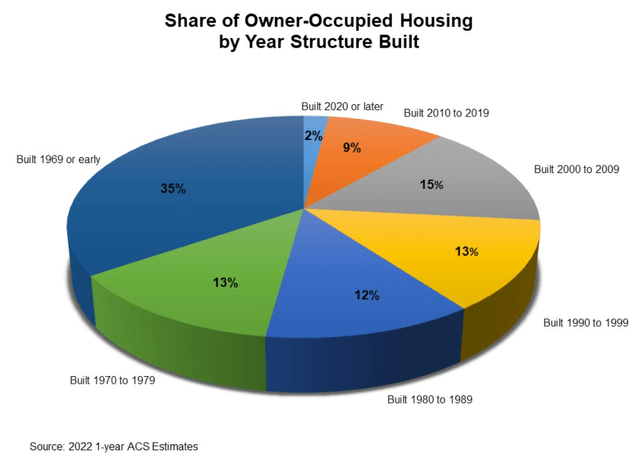
35% of homes were built 1969 or earlier.
Mathematically, an average home age of 50 years would correspond to 1% of inventory getting demolished each year.
Given the skewing in distribution and aforementioned improved materials/techniques, demolition rate is likely lower than 1% of inventory going forward.
It is likely somewhere in the range of 0.5% of inventory to 1% of inventory.
Even at the low end, 0.5% of 146 million existing units is 730,000 units lost each year.
With this in mind, it becomes a bit more clear why a drop in new supply from 1.6 million units to 1.3 million units is a big deal.
That takes the net new supply number from 870,000 (1.6 million minus 730K) to 570,000 (1.3 million minus 730K). That is a 34% drop in supply.
570,000 net new units annually is not enough to keep up with demand. We will dig into that further later, but first, let us explore why supply is dropping.
Why is supply dropping?
Multiple factors have materially shifted the supply curve to the left:
- Normalized cost of capital (higher than previous environment)
- Labor costs
- Equipment/materials cost
- Regulatory burdens on construction
In early 2022 the Federal Reserve commenced one of the most aggressive hiking cycles in history. The Fed Funds rate shot up from essentially 0 to over 5 percent.
S&P Global Market Intelligence
Simultaneously, and largely in response, capital stopped flowing to public real estate companies with REITs selling off and capital raises all but vanishing. There were 2 immediate effects:
- Cost of debt capital became expensive.
- Cost of equity capital became expensive.
Just as the low WACC ushered in significant supply in 2021, the now high WACC makes it difficult for developments to pass underwriting standards. With a high cost of capital, any development under a 6% cap rate just doesn’t work, and most of the time the hurdle rate is going to be 7% or higher.
These higher hurdle rates are made even harder to achieve by cost of construction increasing.
Inflation has been high the last few years and it hit disparately. Construction was among the hardest-hit areas, with cost of materials spiking post covid.
FRED
Labor costs in construction didn’t rise as sharply, but still increased significantly.
FRED
The one bright spot among materials is lumber staying quite cheap.
TradingEconomics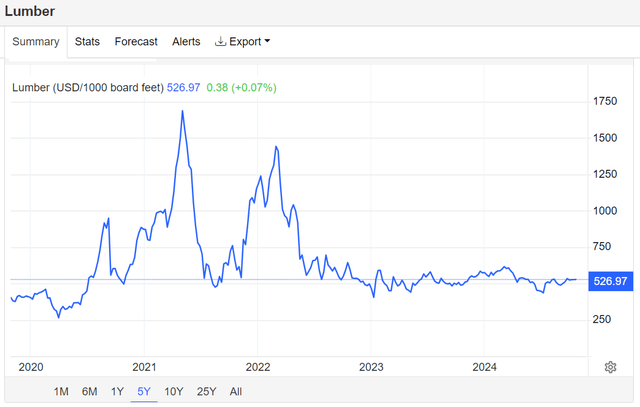
Even the lumber, however, is likely to get more expensive in 2025 and beyond due to substantial sawmill curtailments which will limit supply.
Finally, and perhaps the biggest source of construction costs increasing, is regulation.
Yardi Matrix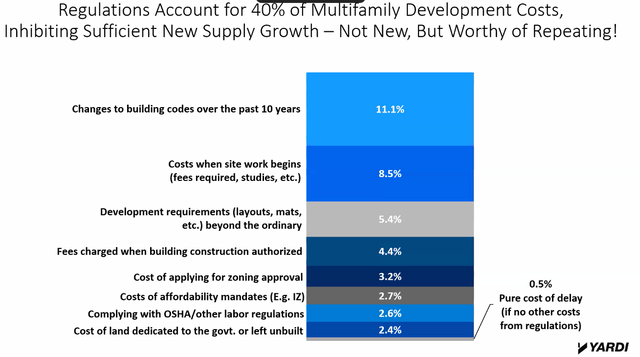
Yardi Matrix cites fully 40% of the cost of building an apartment as regulatory burden.
11.1 percentage points of that 40% was added in the last 10 years.
The effect of a higher cost of capital in addition to the various increases in construction costs is the supply curve shifting to the left.
2MC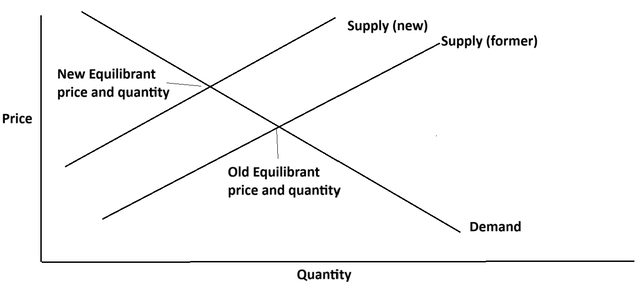
Price is of course the classic Y axis for a supply/demand chart, but in this case, it is a proxy for whatever the relevant metric is (NOI, Sales price, rental rates).
- At any given level of rent, fewer apartments will be built
- At any given sales price point, fewer new homes will be built
Developers can’t really develop when it is not economically viable to do so, which is why in 2024 new starts are limited to the handful of situations where it does meet hurdle rates.
While supply is choked by the aforementioned factors, demand growth remains robust.
Special property of residential real estate: Inevitability of housing demand
In just about every other real estate sector, future demand is unknown.
- Self storage demand depends on what percentage of the population is willing to pay to store stuff
- Retail demand varies widely between countries in square feet per capita
- Office demand depends on how future workflows shape up
- Industrial demand fluxes with efficiency of inventory turnover in warehouses and the percentage of sales that go through e-commerce.
These variable demand volumes can be both good and bad, it just makes the outlook of any given sector somewhat dependent on difficult to predict underlying factors.
Residential real estate is different because it is always in demand. People will always need somewhere to live.
It might flex a bit between different types of residential real estate, but the overall demand for housing units is always there. Historically, overall demand for housing units has trended up consistently due to population growth and GDP per capita growth stimulating household formation.
Between immigration and organic population growth, we see the centuries long trend in increased housing demand continuing.
Population growth
Birth rates in the U.S. have dropped significantly as families are both having kids later in life and having fewer kids on average.
FRED
However, domestic population growth is counterbalanced by significant net immigration.
According to Pew Research:
The number of immigrants living in the United States increased by roughly 1.6 million people in 2023.
Population growth directly corresponds to demand for housing units, with the swing factor being household formation. The number of separate households as a percentage of population is correlated with GDP per capita.
In weaker economies, households are larger, with perhaps adult kids still living with their parents or even 2 families living under the same roof. In stronger economies, household formation picks up, resulting in more households relative to the overall population.
GDP has been reasonably strong, along with household formation.
Housing Demand > Housing Supply
During the housing bubble that preceded the Financial Crisis of 2008, housing inventory was overbuilt, but since the Financial Crisis, incremental housing demand has mostly exceeded new supply resulting in declining vacant inventory shown below.
FRED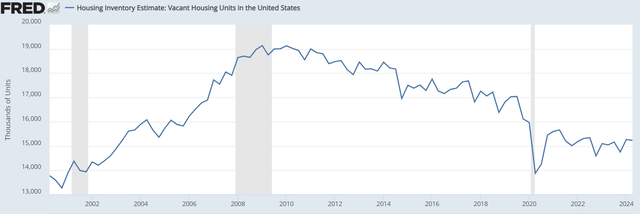
Note that the FRED data above counts vacation homes and 2nd homes as vacant, so the number of available housing units is actually significantly smaller.
Inventory is getting increasingly tight and given the limited new starts in 2024 it will likely get tighter.
Resolving the imbalance
Temporary imbalances frequently happen, yet the economy has a way of restoring equilibrium. The current imbalance in residential real estate is that while demand growth is outpacing new supply, it remains difficult for supply to rise to meet the demand because construction costs are too high relative to real estate NOI.
The supply of housing units is limited by the economic viability of building. WACC is greater than risk-adjusted return on invested capital (ROIC).
There will be increasing pressure as inventory gets tighter and tighter, with 2 potential resolutions:
1. WACC decreases
Or
2. ROIC increases
WACC has come down slightly with the Fed cutting, but the 10-Year treasury, against which many real estate developments are benchmarked, remains well above 4%. The “neutral” Fed Funds rate is now thought to be closer to 3% which with any sort of normal yield curve would suggest the 10-year Treasury won’t get that much lower.
As such, there is likely not enough room to give on the WACC side of the equation.
The more likely restoration of equilibrium is an increase to ROIC.
As overall housing units get increasingly undersupplied, the market clearing price (rental rate of apartments or sales price to homebuilder) will rise until such a point that development becomes sufficiently viable to build enough units to restore equilibrium.
Therefore, we are anticipating a substantial increase in NOI for incumbent real estate owners/operators as rental rates and sales price of newly built homes rise.
Distribution of NOI Increase Across Residential Real Estate Vertical
Housing demand can shift between the categories of housing:
- Savings rate influences homeownership versus rentals
- Wage growth can swing demand between MH and Single Family Housing (SFH)
- Mortgage rates influence the relative affordability of renting vs owning
In recent periods, many factors have swung in favor of renting over owning.
The personal savings rate has declined to about 4% which suggests a diminishing portion of the population will be able to afford down payments.
FRED
Additionally, mortgage rates remain stubbornly high even as the Fed cuts.
TradingEconomics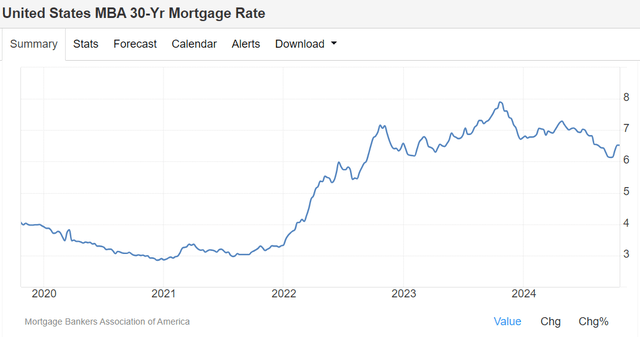
With more expensive mortgages, interest payments are looking expensive relative to apartment rent.
As such, we anticipate mix shift from homeownership to renters.
There are, however, a couple of counterbalancing factors. Homebuilders have very streamlined construction processes so their wave of starts from 2021 was already absorbed while many of those apartment starts are still being delivered in 2024-2025. The wave of apartment deliveries is being well absorbed, but it is stalling rental rate growth in 2024 and anticipated to keep rental rates in check through the first half of 2025.
Thus, the current supply picture is a bit more favorable for single family homes.
Manufactured housing has a different set of fundamentals, with seemingly permanently restricted supply based on zoning. As MH never had the supply boom of 2021, it has substantially outpaced the other forms of housing in terms of organic NOI growth. Existing MH communities with vacant lots have the ability to add new supply in a way that external developers cannot, which preserves most of the value creation for the incumbents.
Over time, the relative profitability of the various housing sectors will fluctuate. Mortgage rates and personal savings rates can change quickly. Thus, it is difficult to pinpoint an ever-changing focal point of organic growth within the residential real estate industry.
However, overall demand for housing is inevitable, and housing units are substantially undersupplied. In the process of correcting the undersupply, we anticipate significant asset value and rental rate growth.
Valuation: reasonable value or cheap across the spectrum
Back in 2021, much of the residential related companies were trading at high valuations. Apartment REITs had an average AFFO multiple of 32X.
S&P Global Market Intelligence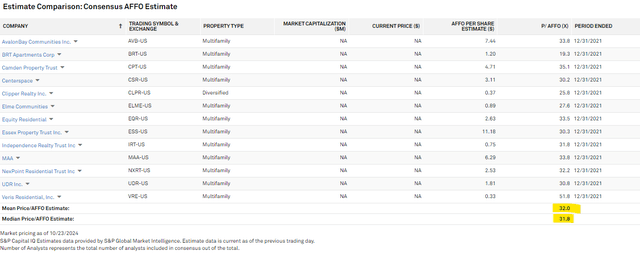
Single Family Rental REITs also traded at just over 30X AFFO a few years ago and now trade at about 22X.
S&P Global Market Intelligence
The lumber related REITs, Weyerhaeuser (WY) and PotlatchDeltic (PCH) were trading at $40 and $60, respectively.
Today, valuations across the residential supply chain are much more attractive. Apartment REITs are now trading at 19.7X forward AFFO.
S&P Global Market Intelligence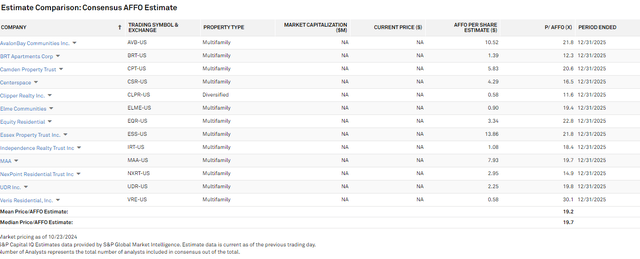
The timber/lumber REITs are much cheaper, with WY and PCH at 81% and 74% of NAV, respectively. Valuations have cratered due to low lumber prices, but mill closures at higher operating expense competitors portend rapid recovery in lumber segment EBITDA for the timber REITs once homebuilding eventually kicks off to meet the undersupply.
Even the homebuilders which have had strong market price performance remain at quite reasonable valuations. Lennar Corp. (LEN.B) is trading at 11X forward earnings despite sell-side consensus projecting substantial growth.
S&P Global Market Intelligence
Manufactured housing REITs are a bit pricier with AFFO multiples in the mid-20s, but the organic growth outlook is strong enough that valuation appears reasonable from a PEG (price to earnings growth) type of perspective.
Pricing Does Not Seem to Correlate with Fundamental Outlook
Pricing of publicly traded stocks in the residential vertical seems to be more correlated with volume of activity than forward fundamentals.
Most of these stocks hit all-time highs in 2021 despite it being a time of relatively bad fundamentals. The zero-interest-rate environment threatened to create long-term oversupply, which would eventually choke growth rates.
Rapidly rising rates essentially cured the fundamental outlook by curbing development and ushering in an era of undersupply that is likely to lead to substantial organic NOI growth for existing properties.
Yet, the companies are trading at reduced valuations when forward fundamentals are strengthened. We see it as an opportunity.
The Residential Infrastructure Basket
Unforeseen changes to wages, GDP, personal savings rate or even consumer preferences could flex demand between various styles of housing. However, due to the reasons discussed earlier, we see demand for overall housing as largely inevitable.
A balanced investment across the housing spectrum is positioned to benefit regardless of how consumer trends in housing consumption shift.
We own:
- Apartment REITs
- Homebuilders
- Timber REITs
- Manufactured housing communities/developers
- Manufactured housing manufacturers
The overall basket captures growth in demand for housing in whatever form it takes and right now, entry valuation is compelling.
Risk factors for the inflection point thesis
The upward inflection point in NOI growth is predicated upon positive population growth and high construction costs, forcing rental rates/sales prices to a level that makes development viable.
These economic forces will not work if either of the following happens:
- Overall population growth turns negative in the U.S.
- Construction costs decline materially
Historically, population and construction cost have largely gone up over time, but it would behoove investors in residential real estate to watch for policy or economic shifts that could change the pattern.
Read the full article here


