")

 2023 winning Pueblo Chili cook off contest green chile recipe, non-commercial category. It’s called Pueblo green chile for a reason, this recipe is a one pot solution with 4 lbs roasted, peeled, diced green chile")

")
Introduction
AvalonBay Communities (NYSE:AVB) is currently trading at about 18.6x 2024 FFO and slightly above their four-year average dividend yield. They are also trading at a premium to the sector as measured by the P/AFFO. In this article, we estimate AvalonBay’s value using the net asset value per share (NAVPS). The NAVPS of a REIT is not as readily available as the other valuation statistics. One reason for this is because there is a fair amount of subjectivity that is required to estimate the NAVPS. Notwithstanding this limitation, there are well reasoned studies that support the view that purchasing REITs at a discount to NAVPS leads to outperformance and, conversely, purchasing REITs at a premium to NAVPS leads to underperformance. At a minimum, investors can use the NAVPS in conjunction to the other valuation statistics to support an investment action.
There are several variables in estimating the NAVPS, but the three main items are the net operating income (NOI), the capitalization rate (cap rate) and the long-term debt. Since these are the three main items and the estimate of NAVPS is subjective, we offer the reader color in how we use these inputs and their relation to the overall performance and strategy of AvalonBay.
Using the framework described, we find that AvalonBay has a net asset value per share of $178.29 which indicates that shares are overvalued and that a hold recommendation is warranted.
Overview and Strategy
There are cycles that buoy AvalonBay’s business model. An important one is the high cost of homeownership. 92% of AvalonBay’s NOI come from apartments that are in the established coastal markets of New England, the Metro New York/New Jersey region, the Mid-Atlantic region, California and the Pacific Northwest. While these areas tend to have a higher median income than the rest of the country, they also have an even higher cost of homeownership which more than offsets the benefits from the higher median income. Please see Exhibit 1.
Exhibit 1. AvalonBay Investor Day Presentation November 2023 (AvalonBay Presentations)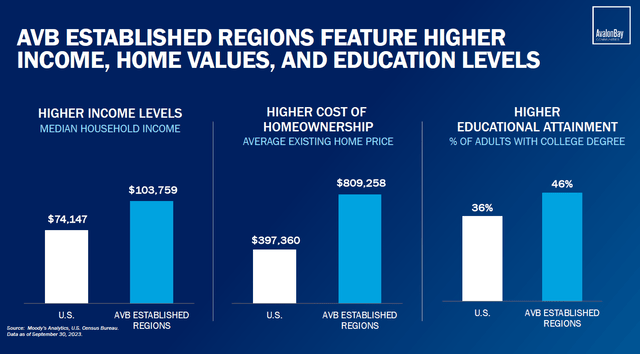
In addition, the established regions tend to have high regulatory barriers that limit new housing supply entering the market, another tailwind for AvalonBay.
With respect to housing demand, AvalonBay is not resting on their laurels. They are expanding to Sunbelt regions which have growing employment in high wage industries that also exhibit elevated home prices. The expansion areas are Raleigh-Durham and Charlotte in North Carolina, Dallas and Austin in Texas, Southeast Florida and Denver, Colorado. The expansion regions have less barriers to entry for new housing supply, but as the CIO suggested in the recent earnings call, there is more than enough demand to offset the new supply entering the market. For the expansion markets, AvalonBay’s competitive advantage is going to come from its scale, expertise and their access to lower cost of debt. AvalonBay has a A3 rating from Moody’s and a A- credit rating with S&P. Both have stable outlooks. Assuming developers in expansion markets have roughly the same access to labor, and raw materials, they will likely not have access to lower cost of debt than AvalonBay.
Net Operating Income
NOI for 2023 was $1.887 billion which was a growth of 8.32% versus 2022 NOI and a compound growth of 13.8% from 2021 NOI. For 2024, management has guided a 2.1% growth in NOI. The growth is decelerating which would support the strategy to rebalance the portfolio towards the expansion markets. Currently, the expansion markets make up 8% of the portfolio and AvalonBay has signaled a target of 25% of the portfolio for the expansion markets. The NOI figure mentioned includes same store NOI as well as communities categorized as stabilized and under redevelopment. Stabilized communities were those acquired during the year and redevelopment communities are those that have or are in some form of redevelopment. AvalonBay also purchases vacant land or land with improvements and then razes it to build their apartment communities. Vacant land, land held for sale and assets under development do not contribute to NOI.
An increase in NOI is going to be tied to leases and leases are a function of occupancy. For leases, AvalonBay expects lease renewal rates to come in slightly above 4% from 2023 numbers. For Q1 2024 versus Q1 2023, average monthly revenue per occupied home was $2,967 versus $2,842, which is in line with what we can expect moving forward. Physical occupancy was 95.6% in Q1 and 95.5% in April and May. These are in line with historical averages for the sector.
Source: AvalonBay 10-K for 2023 and 10-Q for Q1 2024, AvalonBay May 2024 Investor Presentation
Cap Rates
For Q1 2024, the implied cap rate for apartment REITs was 6.15% which matches the average cap rate for the Apartment sector from the first quarter of 2000 to the first quarter of 2024. While this might suggest a reversion to the mean dynamic, the spread between the implied cap rates and the US 10-year Treasury is only 199 basis points and well below the 295 basis point average for the period. Please see Table 1.
| Table 1: Implied Cap Rate and Spread to the US-10 Year | |
| Implied cap rate | 6.15% |
| Long-term average | 6.15% |
| Current implied cap rate spread to the US 10-year | 1.99% |
| Long-term average | 2.95% |
Source: Nareit T-Tracker, St. Louis Federal Reserve and author’s calculations. The spread was estimated using a two-quarter lag for the US 10-year Treasury. We found a higher R-squared with the lag.
Peeling behind the numbers, there is industry-wide dynamic that is playing out. Sellers of real estate assets are waiting for a lower interest rate environment in which asset values will be repriced higher and buyers are pointing to the current interest rate environment which justifies a lower price point for the assets. The net effect is that transaction volume is muted and is about where it was in the 2017-2019 time period.
In terms of our analysis, we shall use the 6.15% figure as a cap rate, but as a caveat, if the cap rate spread to the US 10-year reverts to historic norms then that would mean a higher cap rate and a lower net asset value.
Debt
AvalonBay has $8.043 billion in debt, which is about 23.3% of their capital structure and has a debt to EBITDA ratio of 4.06. Both metrics are well below the sector averages and consistent with similar credit-rated apartment REITs. AvalonBay does have three notes maturing in the relatively near term. There is a 3.66% note for $300 million which will mature in November this year. They also have a 3.55% $525 million note that matures in June 2025 and a $300 million 3.62% note maturing in November 2025. Taken together, this represents about 14% of their total indebtedness.
Source: REITWatch April, 2024
They have a 5.35% note that matures on June 1st, 2034 that exchanged hands at a 5.21% yield. Should AvalonBay replace the maturing notes with notes of a different tenor, they are likely to have a higher interest rate expense.
Other Balance Sheet Items
As mentioned earlier, AvalonBay sometimes buys vacant or improved land and then develops it into an apartment community. Two items on the balance sheet that reflect this are “construction in progress, including land” and “land held for development”. They had one “real estate asset held for sale” as of Q1. In general, AvalonBay intends to reposition their portfolio by opportunistically disposing of assets in their current markets and then acquiring assets in expansion markets until they get to the 25% allocation.
AvalonBay had investments in five unconsolidated entities with ownership interest ranging from 20.0% to 50.0%. These items are carried on their balance sheet at fair value.
Net Asset Value Per Share
Please see the table below for our estimate of the net asset value per share.
To arrive at our estimate, we take the 2023 NOI and project at growth rate of 2.1% as guided. We take the 2024 NOI figure and discount it by the implied cap rate to arrive at the operating asset value. We subtract debt and then divide by the shares outstanding to arrive at net operating asset per share.
We then calculate the nonoperating asset per share and add this to the net operating asset per share to arrive at our net asset value per share estimate of $178.29.
| Table 2: Net Asset Value Per Share Estimate ($ in thousands except per share data) | |
| Projected NOI | $ 1,926,370 |
| divide by Implied Cap Rate | 6.15% |
| equals Operating Asset Value | $ 31,323,085 |
| minus Debt | $ 8,043,242 |
| equals Net Operating Assets | $ 23,279,843 |
| Shares Outstanding | $ 142,223 |
| Net Operating Asset per Share | $ 163.69 |
| Nonoperating Asset per Share | |
| Construction in progress, including land | $ 1,210,773 |
| Land held for development | $ 211,546 |
| Real estate assets held for sale, net | $ 9,629 |
| Cash and cash equivalents | $ 287,892 |
| Restricted cash | $ 135,658 |
| Unconsolidated investments | $ 220,384 |
| Shares Outstanding | 142,223 |
| Nonoperating Assets per Share | $ 14.60 |
| Net Asset Value per Share | $ 178.29 |
Considerations
AVB closed at $203.88* and there is a meaningful divergence between the current stock price and our estimate of the net asset value per share. There are two items to consider with respect to this. Firstly, REITs such as AvalonBay that have low debt levels and a good track record of capital allocation** tend to be given a premium in the marketplace. On the minus side, the NAVPS estimate did not contemplate “asset preservation capex” which are capital expenditures that will not result in increased revenue or expense saving. These are capital expenditures that are required to maintain the current apartment units. As a rough estimate, asset preservation capex is about 6-7% of NOI for AvalonBay. In this particular case, our bias is towards ignoring both any premium for low debt and capital allocation track record and any discount for the asset preservation capex estimate. One washes the other.
*Closing price on June 26, 2024. ** Morningstar assigns an “exemplary” capital allocation score to AvalonBay. In assigning the score, Morningstar looks at balance sheet items, company investments and shareholder distributions.
The last time the shares touched our estimate was in early March. The stock traded close to our estimate in the middle of April as well.
Seeking Alpha and Trading View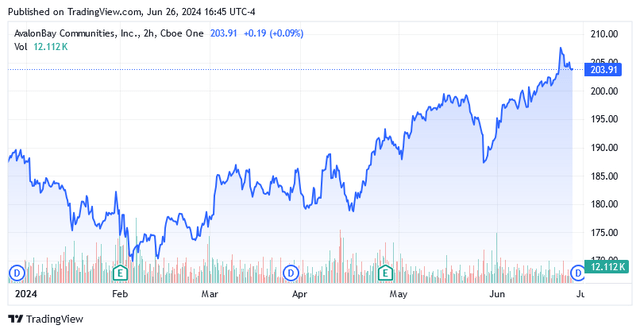
Risks
There are at least two risks worth keeping in mind. REIT performance is impacted by the level and expected direction of interest rates. A “higher for longer” scenario would mean that as debt comes due, they will have to be refinanced at a higher rate. While the NAVPS estimate incorporates debt, it does not incorporate interest expense. Secondly, the strategy of expanding to Sunbelt markets carries risk not directly mentioned. Elevated homeownership costs is one but not the only competition for AvalonBay. Investors of different sizes can and have purchased apartment units with the main purpose of earning rental income. There are other REITs that have access to relatively cheap debt that also want to reposition their portfolio towards the Sunbelt regions.
Conclusion
In terms of the business, AvalonBay is proceeding with their blueprint and there is no obvious departure in their strategy.
In terms of an investment, while the P/FFO measure points to the shares being fairly valued it is helpful to corroborate this with a valuation measure that considers a different aspect of the business. Having both measures suggest there is no margin of safety at the current price increases confidence that a hold recommendation is warranted.
Stated differently, a purchase of the stock at the current price can be expected to market perform. A purchase price that is closer to the net asset value per share would position the investor to outperform the market.
Read the full article here
")

")

")
")
")