


By Garey J. Aitken, CFA & Timothy W. Caulfield, CFA
Falling Yields Spark Canadian Stock Surge
Market Overview
Following a subdued second quarter, the S&P/TSX Composite Total Return Index (‘TRI’) surged 10.5% in Canadian dollars in the third quarter to reach new all-time highs. The third-quarter advance marked the strongest absolute return quarter for Canadian equities since the 17.0% rebound in the second quarter of 2020, immediately following the COVID-related selloff earlier that year. The S&P/TSX Composite TRI has advanced 17.2% year to date and 26.7% over the last 12 months — heady returns for a market posting meek operating earnings growth, albeit with robust market expectations for double-digit earnings growth in 2025. Canadian equities also outperformed the S&P 500 Index’s (SP500, SPX) advance of 4.6% in the third quarter (in Canadian dollars) — the first time the benchmark S&P/TSX Composite has outperformed the S&P 500 in seven quarters.
Helping propel equity markets to new heights was a meaningful drop in benchmark 10-year interest rates in Canada and the U.S., ending the second quarter at 2.96% and 3.78%, respectively. Interest rates now sit well below their respective 4.24% and 4.99% October 2023 highs. The decline in interest rates, and subsequent discount rates, has direct positive implications for equity valuations, all else equal. The U.S. Federal Reserve formally embarked on their new rate-cutting cycle with a 50 basis point decrease in September following the Bank of Canada’s third 25 bps cut since June. For the BoC, a less robust economy in Canada relative to the U.S. and a more highly indebted homeowner facing pending mortgage rate renewals has contributed to its dovish policy stance.
Declining interest rates undoubtedly played a role in the divergence between sector returns in the third quarter, with more interest rate sensitive and higher-yielding equities generally shining through. All 11 GICS sectors in Canada advanced, with seven of them posting double-digit returns. Real estate, utilities and financials were the three top-performing sectors, while the more defensive consumer staples, along with the more cyclically oriented industrials and energy sectors, posted the weakest returns.
Exhibit 1: Rate-Sensitive Sectors Led Third-Quarter Rally
Note: Total Return. Data as of Sept. 30, 2024. Source: FactSet.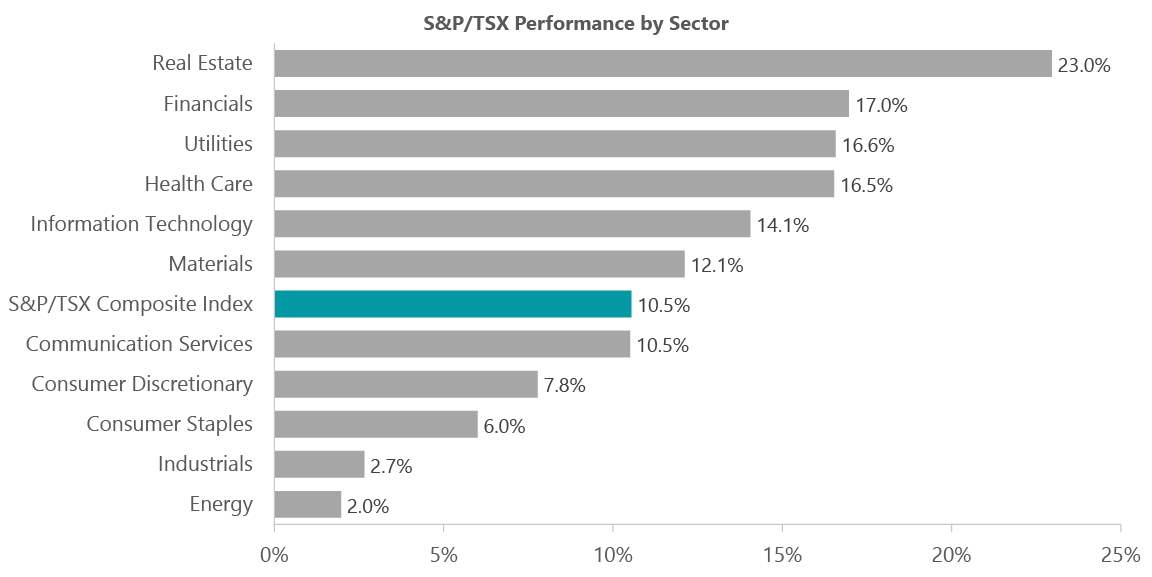
The Canadian information technology sector was strong, despite lacking the generative artificial intelligence (GenAI) enablers of the U.S. equity market — as Canadian sector heavyweight Shopify (SHOP) advanced nearly 20% with improving investor sentiment. With strength in gold and copper prices, the materials sector was also a double-digit advancer. Gold was the standout, with the gold sub-industry in the benchmark advancing over 17% in the quarter. The gold sub-industry now accounts for a 7.5% weight in the broader benchmark. Gold bullion gained 12.7% for the quarter to US$2,636/oz (COMEX) and copper advanced 3.7% to finish at US$4.55/lb (COMEX).
Consumer staples sector saw muted returns in a strong market environment, including sector heavyweight and Strategy holding Alimentation Couche-Tard (OTCPK:ANCTF) declining following its announced proposal to embark upon an acquisition of Japanese convenience store operator Seven & i Holdings (OTCPK:SVNDY). In industrials, share price weakness was more widespread, with concerns surrounding weaker economic conditions having a more immediate impact on profitability in the near term. In energy, crude oil prices continued their slide in the third quarter, ending down 16.4% to US$68.17/bbl (West Texas Intermediate). The significant bifurcation in North American natural gas prices remained, with NYMEX natural gas prices increasing 12.4% to US$2.92/mmbtu (NYMEX) while local Alberta (AECO) prices continued to languish. Noteworthy for the Canadian energy sector, the long-awaited Trans Mountain pipeline expansion is now online, and with LNG Canada expected to start exporting liquefied natural gas in 2025, prospects have improved for regional crude oil and natural gas prices in Western Canada.
Performance Overview
Despite posting strong absolute returns, the ClearBridge Canadian Equity Strategy underperformed the benchmark in the third quarter. The most significant relative detractors from performance included our underweight positioning in the outperforming financials sector, our overweight position in the underperforming consumer staples sector, our overweight positioning and poor security selection in the underperforming industrials sector, as well as poor security selection in the energy sector. Additionally, despite owning a small position in the outperforming Shopify, our large underweight positioning in IT detracted from performance.
A bright spot for performance included an overweight and strong security selection in the outperforming utilities sector. While a higher interest rate environment had been weighing on sentiment for such securities, lower benchmark interest rates and predictable cash flows helped push the sector meaningfully higher in the third quarter. In financials, a resurgent quarter for banks and insurers helped the sector in the benchmark post a 17.0% return, its best quarter since the Global Financial Crisis. Canadian Imperial Bank of Commerce (CM) was a meaningful detractor given our underweight position in the outperforming bank. Our relatively small position in the stock was eliminated on strength during the quarter. In consumer staples, both Alimentation Couche-Tard and Saputo (OTCPK:SAPIF) were weak, meaningfully detracting from performance.
“The S&P/TSX has advanced 26.7% over the last year – heady returns for a market posting meek operating earnings growth, albeit with robust earnings expectations for 2025.”
In industrials, weakness was generally widespread; however, Boyd Group Services (OTCPK:BYDGF), AtkinsRealis Group (OTCPK:SNCAF) and Telus Digital (TIXT) — formerly Telus International — were notable detractors. Shares of Boyd, a provider of auto collision repair services, remained under pressure with weak second-quarter results, driven by mild winter driving conditions leading to fewer accidents as well as many consumers deferring repairs, opting to avoid the rising costs of deductibles and potential insurance premium increases. Though we see these impacts as largely transitory, a swift recovery in industry activity is unlikely. We remain confident in the company’s long-term prospects and ability to compound value through increasing store counts and trends favoring larger collision repair businesses, and added to our position during the quarter.
Meanwhile, Telus Digital shares were particularly weak given the combination of tightening client IT budgets as well as competitive pricing pressures for its services. Having historically sought to maintain higher margins, the company has recently conceded on pricing to win more business. Telus Digital continues to have strong free cash flow conversion and plays a vital role to the digital transformation of its parent and majority shareholder, Telus. While our estimate of the company’s intrinsic value has been revised lower, we still believe it represents a strong risk/reward and we have been adding to the position.
In energy, a few names contributed to weak security selection, including Parex Resources (OTCPK:PARXF), Headwater Exploration (OTCPK:CDDRF) and ARC Resources (OTCPK:AETUF). Parex delivered weak second-quarter results, reflecting disappointing production levels at Arauca — a primary growth vector for the company. A material revision to guidance has resulted in intense share price pressure despite the value of the business being supported by its current production, reserve value and a clean balance sheet. Improving its valuation will depend on management’s ability to regain confidence and execute on its revised plan, which entails more of a focus on lower-risk development drilling and less exploration capital.
Portfolio Positioning
Trading activity in the third quarter of 2024 was broad-based with buying centered around more out-of-favor cyclical names including Headwater, Canadian National Railway (CNI), Bank of Montreal (BMO) and Toronto-Dominion Bank (TD). Additions included two new holdings in the quarter, ATS in industrials and iA Financial (OTCPK:IAFNF) in financials.
We used a recent slowdown in EV sales that pressured the share price to initiate a position in ATS. The company is a global leader in providing advanced automation solutions to customers across key industries such as life sciences, EVs, food and beverage, and consumer products. With its deep expertise and global capabilities, ATS addresses complex manufacturing needs in sectors with high barriers to entry. The company has delivered impressive performance over the past five years, driven by strong organic growth, margin expansion and strategic M&A. Despite near-term headwinds, its strong backlog in less cyclical markets provides solid long-term growth potential. Additionally, ATS is well-positioned to benefit from broader trends like supply chain near shoring and automation as a solution to labor shortages, while ongoing margin expansion and M&A activity offer further upside. We believe the company’s recent bookings success and improving outlook outweigh the concerns investors have regarding the pace of EV adoption.
“Underperforming when momentum and potential are driving animal spirits, and then outperforming when the market is more consumed with risk, exemplifies the essence of the Strategy.”
iA Financial is the smallest publicly traded Canadian life insurance company, providing life and health insurance products, savings and retirement plans, mutual and segregated funds and other financial products. It is an incumbent in Canada’s concentrated life insurance industry, with niche focus on the mid-market (a high-margin business relative to other life insurance segments) with a distinctly large distribution network for its size. This network also benefits the wealth management side of the business, as it is the number one seller of segregated funds in Canada. In the U.S., iA has expanded its footprint both organically and through acquisition. The company’s organic annual capital generation aids its excess capital position, allowing deployment through a steadily increasing dividend and buybacks.
Transactions also included trimming select holdings on strength including a few defensive/more interest-rate sensitive holdings — Enbridge (ENB), Agnico Eagle Mines (AEM), Dollarama (OTCPK:DLMAF), Loblaw (OTCPK:LBLCF), Manulife Financial (MFC) and Colliers International Group (CIGI). We eliminated three positions in the quarter: Wheaton Precious Metals (WPM) in materials as well as Canadian Imperial Bank of Commerce (CM) and Sun Life Financial (SLF) in financials.
At quarter end, the Strategy’s largest sector exposures were financials, industrials, energy and utilities. Relative to the benchmark, the Strategy is overweight the generally defensive/non-cyclical consumer staples and utilities sectors, as well as industrials. The Strategy is most underweight the typically value/cyclically oriented financials, materials and energy sectors.
Outlook
Following two years of more challenging relative performance for the ClearBridge Canadian Equity Strategy, we provide perspective on our recent performance, investment approach, key elements of our performance objectives, as well as expected performance profile. More specifically, over the trailing two-year period the Strategy has notably underperformed the S&P/TSX Composite TRI by about 250 bps, annualized (gross of fees), and 290 bps (net of fees) a disappointing result. However, zoom out one additional year to capture the trailing three-year period and the Strategy is ahead of the benchmark by an equal magnitude, a strong result that in fact exceeds our relative performance objectives detailed below.
Given the stark difference between two- and three-year performance, this period serves as a helpful illustration of the makings of our performance profile over time. Our investment style in combination with our performance objectives can tend to result in distinctive performance patterns depending on the market’s course. For instance, in the past 24 months, the Canadian equity market advanced at an exciting 17.8% per year while the Strategy advanced 15.3% per year (gross of fees) and 14.9% (net of fees). In the 12-month period prior to that, the market declined 5.4% while the Strategy advanced 5.7% (gross of fees) and 5.3% (net of fees). Taken in aggregate, the Strategy has outperformed by about 240 bps annualized (gross of fees) and 200 bps (net of fees) over the three-year period, reflecting the power of downside protection — a product of our investment approach that manifests in our distinctive performance profile over time.
Our focus is on owning high-quality businesses where we believe risk is being discounted into the share price, where we have good visibility to future high profitability that allows us to effectively handicap risk/reward, solid secular growth prospects and effective capital allocation that reinforces our thesis. We are in search of the best risk/reward relationships we can find, while remaining mindful of concentration/diversification considerations or unintended correlations within the portfolio. In turn, our performance objectives reflect what our clients can expect from us over time, incorporating four distinct elements — absolute returns, relative returns, risk and risk-adjusted returns.
Absolute returns are first and foremost, and it should be noted that we are more than satisfied to see the Strategy advance 15.3% annually over the past two years, even if it wasn’t keeping up with the Joneses. These returns reflect the client being compensated for the risk inherent in equity investing, with our specific objective to exceed the equity cost of capital. Regarding relative returns, we strive to produce 200+ bps of excess annual return beyond the benchmark, a level that we believe will remain competitive in the marketplace going forward. As for risk, our primary objective relates back to ensuring we produce adequate absolute returns while maintaining a volatility profile for the Strategy that is less than that of the benchmark. Finally, we have a beta target of 0.8 to 0.9. This is a defining element of our approach, combining to target excess returns while simultaneously assuming less risk/volatility than the benchmark — concluding in our fourth and ultimate risk-adjusted return objective that can be quantified as 300+ bps of alpha, annualized.
While our performance profile is more intuitive when factoring in the various elements of our investment approach and performance objectives, markets are unpredictable. The vagaries of equity markets and unique elements of any market cycle can result in the Strategy outperforming the benchmark in certain stronger environments and vice versa, but our investment approach and performance objectives remain consistent. Over this particular trailing three-year period, the experience of underperforming when money is flowing freely and momentum and potential are driving animal spirits, and then outperforming when the market is more consumed with risk, exemplifies the essence of the Strategy.
With superior predictability and downside protection available at a reasonable price, we continue to appreciate and emphasize the more defensive posturing of the Strategy. Our positioning can provide ballast in more challenging equity market environments, allows the Strategy to power ahead with predictable growth, and serves as dry powder when better risk/reward opportunities arise. With this approach, the ClearBridge Canadian Equity Strategy has successfully navigated various market conditions characterized by both strong and weak sentiment, as well as shifts in sector leadership and economic landscapes, for more than 40 years. Our bottom-up strategy prioritizes identifying and capitalizing on market inefficiencies. We will seize on opportunities as they arise, seeking to build on our track record of delivering superior absolute, relative and risk-adjusted returns over the long term.
Portfolio Highlights
During the third quarter, the ClearBridge Canadian Equity Strategy underperformed its S&P/TSX benchmark. On an absolute basis, the Strategy generated gains in eight of the 10 sectors in which it was invested (out of 11 total). The primary contributors were the financials and utilities sectors while the main detractor was the industrials sector.
Relative to the benchmark, sector allocation and security selection were both negative. In particular, a sector underweight in the strongly performing financials sector, as well as an overweight to the underperforming consumer staples sector detracted. Negative stock selection in industrials and energy detracted further. On the positive side, security selection in utilities, an overweight to utilities and an underweight to energy contributed to relative performance.
On an individual stock basis, leading absolute contributors included Royal Bank of Canada (RY), Toronto-Dominion Bank (TD), Brookfield Corporation (BN), Bank of Nova Scotia (BNS) and Fortis (FTS). Top absolute detractors included Boyd Group Services, Parex Resources, Cenovus Energy (CVE), Telus Digital and Headwater Exploration.
Garey J. Aitken, CFA, Head of Canadian Equities
Timothy W. Caulfield, CFA, Dir. Canadian Eq. Research
|
Past performance is no guarantee of future results. Copyright © 2024 ClearBridge Investments. All opinions and data included in this commentary are as of the publication date and are subject to change. The opinions and views expressed herein are of the author and may differ from other portfolio managers or the firm as a whole, and are not intended to be a forecast of future events, a guarantee of future results or investment advice. This information should not be used as the sole basis to make any investment decision. The statistics have been obtained from sources believed to be reliable, but the accuracy and completeness of this information cannot be guaranteed. Neither ClearBridge Investments, LLC nor its information providers are responsible for any damages or losses arising from any use of this information. Performance source: Internal. Benchmark source: Standard & Poor’s. |
Original Post
Editor’s Note: The summary bullets for this article were chosen by Seeking Alpha editors.
Read the full article here


")
")
