PERFORMANCE SUMMARY
|
Cumulative |
Annualized |
|||||
|
3 Month |
YTD |
1 Year |
3 Year |
5 Year |
10 Year/ LOF 1 |
|
|
Fidelity High Income Fund (MUTF:SPHIX) Gross Expense Ratio: 0.88% 2 |
5.28% |
9.05% |
15.96% |
2.32% |
3.06% |
4.15% |
|
ICE BofA US High Yield/US High Yield Constrained Blend |
5.28% |
8.03% |
15.67% |
3.08% |
4.53% |
4.95% |
|
Morningstar Fund High Yield Bond |
4.41% |
7.36% |
14.05% |
2.87% |
4.17% |
4.17% |
|
% Rank in Morningstar Category (1% = Best) |
— |
— |
16% |
70% |
89% |
52% |
|
# of Funds in Morningstar Category |
— |
— |
654 |
598 |
563 |
425 |
|
1 Life of Fund (LOF) if performance is less than 10 years. Fund inception date: 08/29/1990. 2 This expense ratio is from the most recent prospectus and generally is based on amounts incurred during the most recent fiscal year, or estimated amounts for the current fiscal year in the case of a newly launched fund. It does not include any fee waivers or reimbursements, which would be reflected in the fund’s net expense ratio. Past performance is no guarantee of future results. Investment return and principal value of an investment will fluctuate; therefore, you may have a gain or loss when you sell your shares. Current performance may be higher or lower than the performance stated. Performance shown is that of the fund’s Retail Class shares (if multiclass). You may own another share class of the fund with a different expense structure and, thus, have different returns. To learn more or to obtain the most recent month-end or other share-class performance, visit Fidelity Funds | Mutual Funds from Fidelity Investments, Financial Professionals | Fidelity Institutional, or Fidelity NetBenefits | Employee Benefits. Total returns are historical and include change in share value and reinvestment of dividends and capital gains, if any. Cumulative total returns are reported as of the period indicated. For definitions and other important information, please see the Definitions and Important Information section of this Fund Review. The fund’s yield and share price change daily and are based on changes in interest rates and market conditions, and in response to other economic, political, or financial developments. Foreign markets, particularly emerging markets can be more volatile than the U.S. market due to increased risks of adverse issuer, political, regulatory, market, or economic developments and can perform differently from the U.S. market. In general, bond prices rise when interest rates fall, and vice versa. This effect is usually more pronounced for longer-term securities. The fund may invest in lower- quality debt securities which generally offer higher yields, and carry more risk. You may have a gain or loss when you sell your shares. Not FDIC Insured • May Lose Value • No Bank Guarantee |
High-Yield Bond Market Review
High-yield bonds gained 5.28% in the third quarter, according to the ICE BofA® US High Yield Constrained Index, rising as credit spreads further tightened amid resilient corporate fundamentals, a sharp decline in market interest rates and the Federal Reserve’s long- anticipated pivot to looser monetary policy.
Amid this favorable backdrop for higher-risk assets, the index picked up momentum after two consecutive solid quarters. Demand for yield-advantaged, credit-sensitive assets remained firm in a risk-on environment, supporting the market’s advance the past three months. Meanwhile, high-yield bond issuance reached a three-year high in September amid decidedly lower yields.
The shift toward global monetary easing gained steam when the Fed lowered its benchmark federal funds rate after a historic hiking cycle that began in March 2022 to combat persistently high inflation. On September 18, the central bank cut rates by 0.50 percentage points, opting for a bolder start in making its first rate reduction since March 2020.
The Fed’s stated goal is to achieve a soft landing for the economy: bring down inflation amid a gradual cooling in the labor market while neither spurring nor slowing economic activity. The central bank has projected the equivalent of two more quarter-point cuts this year.
Almost all asset categories gained sharply in Q3. High-yield bonds gained 1.96% in July, advancing even as investors fretted about a potential recession in the U.S. Volatility spiked, but the index rallied as August (+1.59%) unfolded.
In September, high yield rose in anticipation of the Fed’s mid-month meeting and edged higher after the rate cut. The 1.63% advance for the month bumped the index’s year-to-date gain to 8.03%.
Turning to high-yield performance by quality in the third quarter, lower-quality credits rated CCC and below fared best, gaining roughly 10%. This was considerably better than the B and BB tiers, each of which gained about 4%.
High yield showed broad strength throughout the past three months, with all industry groups in the index notching a gain. Performance dispersion was wide relative to recent history.
Telecommunications (+11%) and media (+10%) were particular standouts. Real estate, which is sensitive to interest rates, gained about 7%, boosted by the potential for lower borrowing costs, while the promise of generative artificial intelligence lifted technology & electronics (+6%). Health care (+6%) also finished ahead of the pack.
In contrast, energy, the largest group in the index for the three months, advanced about 3% and trailed the broader market by the second-widest margin, held back by a dip in oil prices amid worries about the outlook for global demand. Automotive also advanced about 3% for the three months.
Other “laggards” in Q3 included a number of segments that gained roughly 4%: retail, transportation, leisure, capital goods, services, financial services, basic industry and insurance. Consumer goods and utility finished closer to 5%.
Looking at asset categories, high-yield debt solidly outpaced leveraged loans and edged taxable investment-grade bonds, but modestly trailed emerging-markets debt and U.S. stocks.
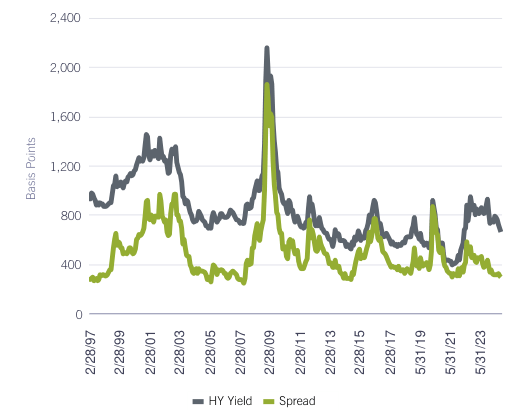
HIGH-YIELD SPREAD AND AVERAGE YIELD (BASIS POINTS*)

|
*1 basis point = 0.01%. Source: Bank of America as of 9/30/24. Yield spread is represented by the option-adjusted spread of the ICE BofA US High Yield/US High Yield Constrained Blend. The average spread is calculated from 1/31/97 through the most recent period. |
THREE-MONTH HIGH-YIELD RETURNS
|
Quality |
Total Return |
|
BB |
4.24% |
|
B |
4.55% |
|
CCC and Below |
10.35% |
|
The ICE BofA US High Yield Constrained Index |
5.28% |
|
Source: Bank of America |
Performance Review
For the quarter of 2024, the fund’s Retail Class shares gained 5.28%, matching the benchmark, the ICE BofA® US High Yield Constrained Index.
The past three months, the fund’s core allocation to high-yield bonds gained 5.42%, edging the benchmark and contributing to relative performance. Much smaller non-benchmark allocations to convertible bonds (+15%) and equities (+6%) each slightly helped. In contrast, modest non-benchmark exposure to floating-rate leveraged loans (+4%) detracted, as did the fund’s position in cash.
By industry, security selection was helpful, led by our picks in real estate and health care. Within the former, an overweight in Uniti Group (UNIT, formerly Communications Sales & Leasing) was the top individual contributor versus the benchmark for the three months, rising 25% as investors warmed up to the company’s planned merger with Windstream Holdings.
In health care, an outsized investment in Community Health Systems (CYH, +14%) notably contributed, as the health system narrowed its quarterly loss and topped revenue expectations. It was among the fund’s largest holdings. Elsewhere in health care, it helped to have non-benchmark exposure to Cano Health (CANOQ, +47%), a primary care chain that exited bankruptcy in July.
The No. 3 contributor was solar installer Sunnova Energy (NOVA), from the utility segment, a fund overweight that rose 31%. The company eased investor concern about its ability to address debt maturities it faces in 2026–2028 with news that it was generating more cash.
Conversely, an underweight in media detracted versus the benchmark in Q3, as did security selection in telecommunications and technology & electronics. Within telecom, lighter-than- benchmark exposure to CenturyLink hurt most, given its roughly 39% gain for the quarter.
Turning to tech, a non-benchmark position in chipmaker Wolfspeed (WOLF) was a noteworthy detractor for the three months, as the maker of chips used in electric vehicles returned about -32%, due to disappointing quarterly earnings and revenue, as well as weakness in global demand for EVs.
An underweight in network infrastructure company CommScope (COMM), up 42% in the index, also hurt.
Lastly, an overweight in New Fortress Energy (NFE, -6%) detracted in Q3, hampered by project delays and cost overruns, particularly with its liquified natural gas developments.
Outlook and Positioning
As October begins, the global business cycle remained in expansion, with a broad shift toward monetary easing and a stable earnings outlook. In Q3, the Fed and the Bank of England each cut its benchmark rate for the first time this cycle, while the European Central Bank and Bank of Canada began to ease in Q2 and dropped rates further the past three months.
Economic expansion in the U.S. demonstrates evidence of both mid- and late-cycle dynamics. Headline and core inflation have declined significantly from 2022 highs, but core inflation, which excludes volatile food and energy costs, remained higher than 3% at quarter end. Near-term recession risk appears muted, but a full pivot to a disinflationary mid-cycle environment remains uncertain.
As of September 30, the market reflects the expectation of two additional rate cuts by year-end, with a total implied reduction of at least one percentage point from the peak rate, including the half-point cut by the Fed on September 18. Of course, the central bank may slow or quicken its pace, depending on how inflation, jobs and consumer spending progress.
While high-yield valuations at quarter end are full relative to history, the market’s credit-quality composition remain strong. The trailing default rate is muted, ending September well lower than the long-term average. Default activity is expected be low, supported by manageable maturity walls, a healthy new-issue market and solid issuer fundamentals. Data paint a complicated and, at times, contradictory picture on inflation, employment and the economy. This, along with uncertainty about the U.S. presidential election, may lead to elevated market volatility through year-end.
High-yield bonds face a higher risk of default and price volatility if investors become nervous about credit conditions. Understanding and balancing credit risk takes deep research into issuers. We draw on a dedicated team of analysts, divided by sector, who research hundreds of companies on a bottom-up basis. We apply intensive bottom-up fundamental credit research with the goal of choosing superior risk-adjusted investments that will help the fund outperform its benchmark. We take a consistent, conservative approach. As part of this strategy, we focus on higher-quality, less-cyclical industries that we believe have the potential to generate adequate returns when the economic backdrop is strong and limit downside capture during challenging conditions.
We look to build a well-diversified, actively managed portfolio in terms of company and industry weightings, although we rarely take meaningful positions in deeply cyclical segments or groups facing strong secular headwinds.
Read the full article here


