


")
QYLD ETF has underperformed
I last wrote on the Global X NASDAQ 100 Covered Call ETF (NASDAQ:NASDAQ:QYLD) about three months ago in an article entitled “QYLD: Risks Outweigh Upside Potential.” In that article, I argued for a sell thesis and my key considerations were quoted below:
The current dividend yield of 11%+ may not be sufficient to compensate for the downside risks. The current option premium is relatively low (because of the low implied volatility) while downside risk is high given the elevated P/E of the Nasdaq index.
Indeed, the fund has underperformed the broader market, as illustrated by the chart below. To wit, it suffers a 1.4% loss and delivers a total return of 1.5% when dividends are included, against a 4.4% price appreciation from the SP 500 (SP500).
Seeking Alpha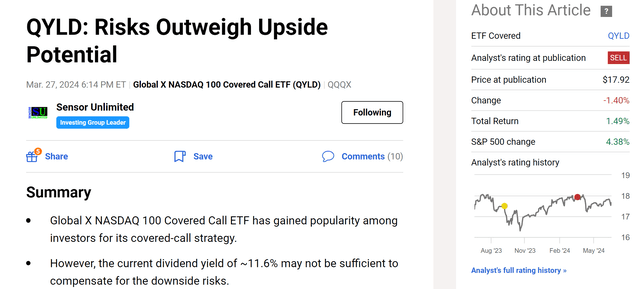
Against this background, this article reiterates my sell rating. My earlier concerns regarding the low volatility and high NASDAQ valuation are still valid. Actually, they have become even more heightened since my last writing in my view. The current VIX of 12.5x hovers among the lowest historical levels, as illustrated by the first chart below. Lower VIX tends to generate lower option income. The valuation of the underlying index has become even more expensive than that at my last writing.
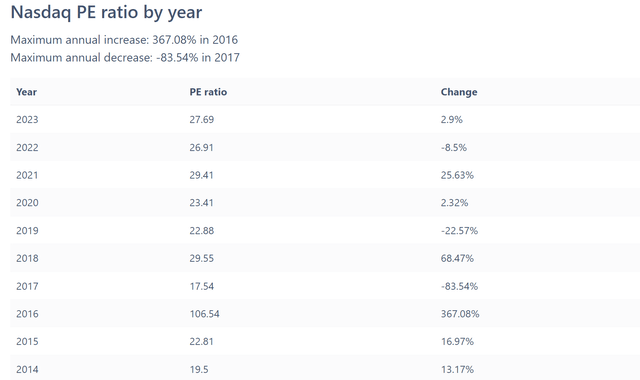
According to FullRatio, the current P/E ratio for the Nasdaq index is 31.6x, compared to 29.6x as of my last writing. To contextualize things against a broader background, the current P/E is also the highest in at least the last 10 years (excluding the 106x P/E observed in 2016, which is an outlier data point in my view).
Besides these concerns, I have begun to develop a few more additional concerns since my last writing given the changes in the macroeconomic parameters, as detailed next.
Seeking Alpha Source: FullRatio.com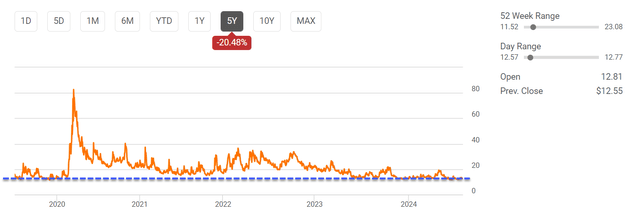
QYLD ETF: basic information
Before going future, let me go over some basic features of the ETF that are directly relevant to the subsequent analyses. For readers new to the fund, QYLD uses a covered-call strategy, as you can read from its following fund description:
QYLD: The Global X Nasdaq 100 Covered Call ETF ((QYLD)) follows a “covered call” or “buy-write” strategy, in which the Fund buys the stocks in the Nasdaq 100 Index and “writes” or “sells” corresponding call options on the same index. QYLD writes call options on the Nasdaq-100 Index, saving investors the time and potential expense of doing so individually.
The strategy employed here is fundamentally sound in my view, and QYLD has relied on it to generate high income for 10 years (and running). Although the fees (0.61%) are a bit too high for our liking, and the strategy is not too hard for individual investors to DIY (more on this later).
The fund tends to lag the border market over the long term, as illustrated by the chart below. As an example, in the past 5 years, QYLD delivered a total return of 40% – quite respectable. However, it compares unfavorably to the SP500’s 100%+ return or the NASDAQ 100 index’s (NDX) 167% total return. I expect such lag to continue in the future because the use of covered options puts a cap on QYLD’s upside potential.
Of course, many QYLD investors are drawn to QYLD primarily because of its high monthly dividend, not price appreciation potential. So in the remainder of this article, I will concentrate on my concerns over its dividends.
Seeking Alpha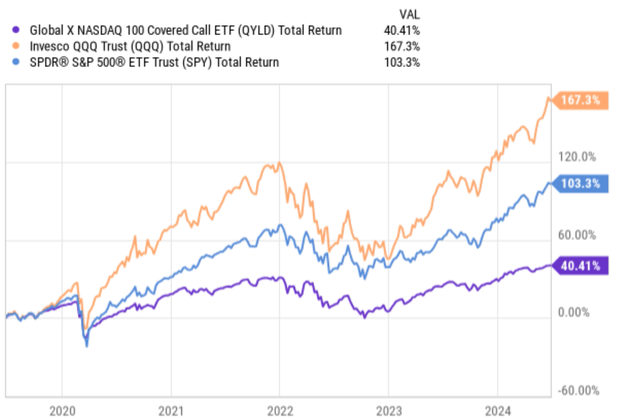
QYLD ETF: risk premium benchmarked by treasury rates
As aforementioned, QYLD’s 11.6% dividend yield is indeed very high in absolute terms. However, talking about yield in absolute terms is not too meaningful in my view. The yield has always to be evaluated in the context of risks. An effective approach to evaluate the risk in my experience is to benchmark its yield against risk-free rates, for example, the 10-year treasury rates (US10Y). As seen in the chart below, QYLD’s historical yield averaged around 11.57% in the past 5 years. Thus, as a side note, the current yield of 11.6% is not that attractive when compared to its historical average to start with.
When benchmarked against 10-year treasury rates, the picture becomes ever less attractive. The average 10-year treasury rates averaged about 2.45% over the same period, translating into an average yield spread of 9.12%. The current yield of QYLD Is 11.6% and the 10-year treasury rate is about 4.23%, translating into a yield spread of 7.41%. It is not only substantially below the average spread, but also among the thinnest levels in at least 5 years (because QYLD’s current yield is on par with its historical average and 10-year rates are around multi-year highs).
Seeking Alpha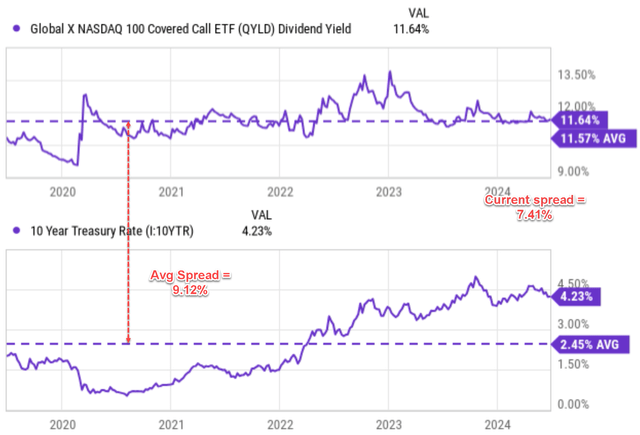
QYLD ETF: Other risks and final thoughts
As aforementioned, the option strategy is fundamentally sound in my view, but the fees are a bit too high for my liking. I apply the strategy myself sometimes, mostly when the volatilities are noticeably above average. A fee ratio of 0.61% may not look like much. But it is about 6% relative to the 11% yield the fund generates. When I trade options myself, each option costs 65 cents (I trade on Merrill Edge). For QQQ with a share price of ~$480, each option is worth about $48k. Thus, the trading cost is totally negligible.
As an upside risk, the potential of a risk cut (or a series of rate cuts) would change my analysis above. Looking ahead, the market expectations imply large odds for rate cuts in the near future. For example, the chart below shows a screenshot of the CME Group FedWatch Tool which illustrates the market’s current expectation for interest rates in the next 3 months (by Dec 18, 2024). The current Fed rates are in the range of 5.25% – 5.50%.
First, the current expectation implies the chance of a rate hike is non-existent. Second, the current federal funds’ futures contracts imply a 6.3% possibility for the Fed rates to remain in their current range of 5.25% – 5.50%. In other words, the current federal funds’ futures contracts imply a 93.7% possibility for a rate cut of 25 basis points or more. A rate cut would widen the QYLD’s yield spread relative to risk-free rates and make its yield more attractive in terms of reward/risk ratio. However, a rate cut would most likely also lead to price advancements in the underlying NASDAQ index, thus also widening the performance gap between QYLD and the broader market. But of course, this last point is a factor more for investors whose focus is not primarily on current income generation.
All told, my goal is to reiterate my earlier sell rating on QYLD. The key concerns that led to my earlier sell rating (low volatility and high NASDAQ valuation) either have persisted or worsened in my view. Furthermore, I began to develop a few more additional reservations since then. This article details two of them: the narrow yield spread and the fee drag. The prospect of a rate cut is a double-edged sword. It should certainly help QYLD, but I expect it to help the underlying index even more. Thus, in this scenario, I expect QYLD’s total return potential to improve, but its underperformance relative to its underlying index would worsen.
CME Group FedWatch Tool 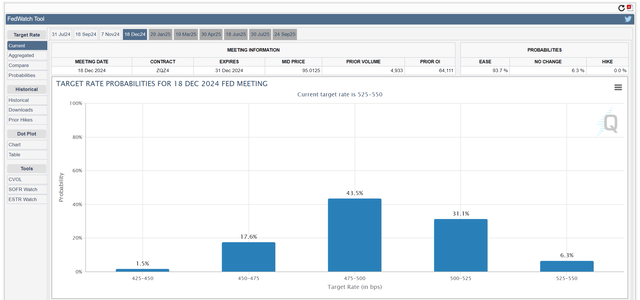
Read the full article here
")
")

")


")