


")
Synopsis
RBC Bearings (NYSE:RBC) is a global supplier of highly engineered precision bearings, parts, and systems for the aerospace, defence, and industrial sectors. RBC’s historical financials have demonstrated robust net sales growth. In addition, its profitability margins expanded annually as well. For its most recent quarter, it continues to report net sales growth as well as robust margins. However, I do notice that its FY2024 growth has decelerated due to its flattish industrial segment.
Looking ahead, the outlook for commercial aerospace is positive. Airliner orders are hitting record numbers as well, due to rising travel demand. However, I do note that its industrial segment performance is mixed due to some markets doing well while others decline. Given RBC’s mixed outlook and lack of margin of safety in its share price, I am recommending a hold rating.
Historical Financial Analysis
Author’s Chart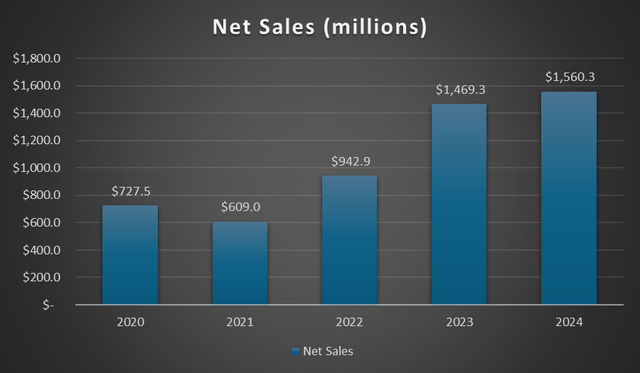
Over the last 5 years, RBC’s net sales have demonstrated robust and consistent growth. Between 2020 and 2024, RBC’s net sales compound annual growth rate [CAGR] is approximately 20.5%.
In 2022, net sales grew 54.8% year-over-year to $942.9 million. This strong growth was driven mainly by its industrial segment, which grew 163.9% year-over-year. This growth was attributed to the acquisition of ABB’s Dodge, which contributed $291.9 million in sales.
In 2023, RBC’s net sales continued to grow, and it reported $1.469 billion. This represents a year-over-year increase of 55.8%. This growth was driven by both its industrial and aerospace and defence segments. They increased by 85% and 12.8%, respectively. The strong growth in the industrial segment was driven by the Dodge acquisition. As for the aerospace and defence segment, it was driven by the commercial aerospace market, which increased 25.4%. This strong growth is attributed to the recovery in the commercial aerospace market.
In 2024, although net sales grew, the growth decelerated. Net sales grew 6.2% year-over-year to $1.560 billion. RBC’s industrial segment growth slowed down to just 0.2% year-over-year. According to its most recent earnings call, the reason behind this is the mixed performance across different end markets, as some were stronger while others declined. RBC mentioned that the mining, energy, and general industrial markets remained strong.
On the brighter side, RBC’s aerospace and defence segment reported robust growth of 20.7%, driven by strength in both commercial aerospace and defence. The growth in commercial aerospace implies that the market is still recovering, which started in 2023.
Author’s Chart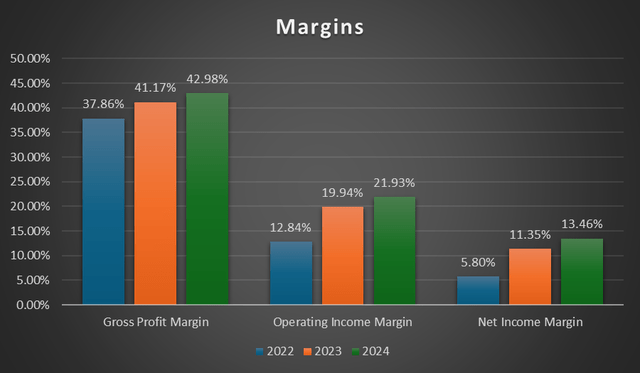
Apart from strong top-line growth, RBC’s margins from 2022 to 2024 have been consistently expanding as well. In 2024, RBC’s gross profit margin expanded from 41.17% to 42.98%. This gross profit margin expansion was driven by cost efficiencies and pricing increases to negate the effects of inflation. Cost efficiencies are driven by integration, product mix, and pricing.
As a result of the gross profit margin expansion and slightly lower operating expenses as a percentage of net sales in 2024, RBC’s 2024 operating income margin expanded from 19.94% to 21.93%. Additionally, its net income margin expanded from 11.35% to 13.46%. RBC’s 2024 diluted EPS increased to $6.41 from $4.94, which represents a year-over-year increase of 29.75%.
Fourth Quarter 2024 Earnings Analysis
For 4Q24, RBC’s net sales grew 4.9% year-over-year to approximately $413.7 million. 4Q23’s reported net sales were $394.4 million. RBC’s aerospace and defence segment increased 16.8% year-over-year. Within this segment, commercial aerospace increased 12.0% while defence grew 29%.
However, its industrial segment was quite flat for the quarter, as it was down 0.4% year-over-year. The weakness in its industrial segment was due to a mixed end-market performance, as some were stronger while others were weaker. RBC reported strength in the waste and water management and power generation markets, while multi-industry aggregate, cement, and oil and gas were weak. As a result, RBC’s industrial segment result for the quarter was flat.
Author’s Chart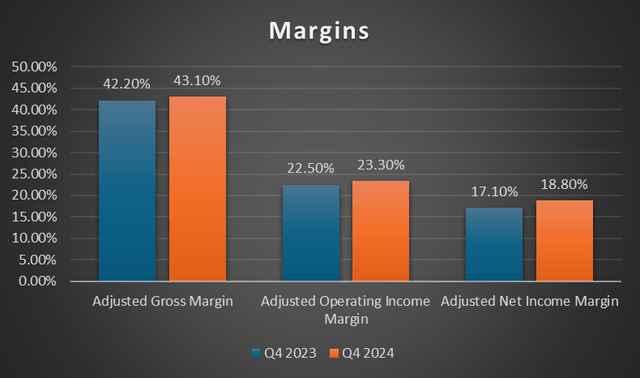
Looking at the chart, RBC’s 4Q24 margins were robust year-over-year. In fact, I do notice modest expansion in all three. Its gross profit margin expanded from 42.20% to 43.10%. The gross profit margin expansion was attributed to Dodge synergies, increased utilisation of aerospace assets, and a shift towards a higher margin mix.
As a result of the gross profit margin expansion, both its operating income margin and net income margin benefited from it. RBC’s operating income margin expanded from 22.50% to 23.30%, while its net income margin increased from 17.10% to 18.80%. Additionally, a reduction in interest expense as a percentage of net sales also contributed to the net income margin expansion. For the quarter, interest expense as a percentage of net sales fell from 5.5% to 4.5%.
Commercial Aerospace
Investor Relations
The outlook for commercial aerospace is looking positive. This positive outlook is driven by a number of factors. Firstly, it is in regard to passenger miles travelled. According to the International Civil Aviation Organisation [ICAO], it is projected that the demand for this year is anticipated to be approximately 3% higher than that of 2019, with the potential to increase to 4%. This represents a CAGR of approximately 0.5% from 2019 to 2024. As a result of the increasing passenger miles travelled, it has increased plane utilisation and decreased retirements.
Statista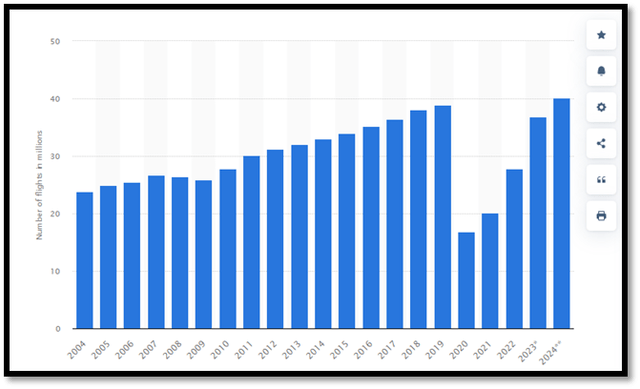
Looking at the chart, the number of flights carried out by the global airline industry has been consistently increasing. When the COVID-19 pandemic hit in 2020, the number of flights decreased drastically to approximately 17 million. After that, it gradually recovered, and 2023’s figures were almost back to pre-pandemic levels. Looking ahead to 2024, the number of flights is forecast to be above pre-pandemic levels and reach approximately 40.1 million.
RBC is the main supplier of bearings to many aircraft OEMs, and it also provides precision products for a large number of commercial aircraft that are currently in operation throughout the world. Therefore, the positive outlook in the commercial aerospace industry is expected to bolster RBC’s outlook.
Record Numbers of Airliner Orders
Airbus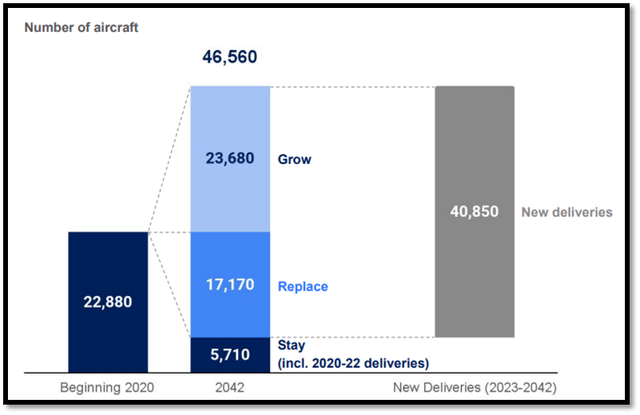
As discussed, travel demand is rising, and the aviation industry is forecast to be above pre-pandemic levels and will continue growing. In addition to travel demand, there is also a shift among airline companies towards planes that are greener and more fuel-efficient. The combination of these factors is causing orders for aircraft to hit record numbers.
According to Boeing, it projects that the market for commercial aircraft will grow to approximately $3.9 trillion by 2032. In addition, Airbus and Boeing anticipate that over 40,000 new commercial aircraft will be required in the next 20 years.
In the beginning of 2020, there were approximately 22,880 aircraft, which included new passenger and freighter aircraft. According to Airbus, this number is expected to increase to 46,560 by 2042. However, do note that currently, plane makers are having issues with delivery due to supply chain issues. On a brighter note, RBC is confident that Boeing’s requirements will recover by the third quarter.
Mixed Industrial Outlook
For context, RBC’s industrial market segment produces engineered components, gearing, and bearings for a variety of diverse industrial markets. These markets are illustrated below.
Investor Relations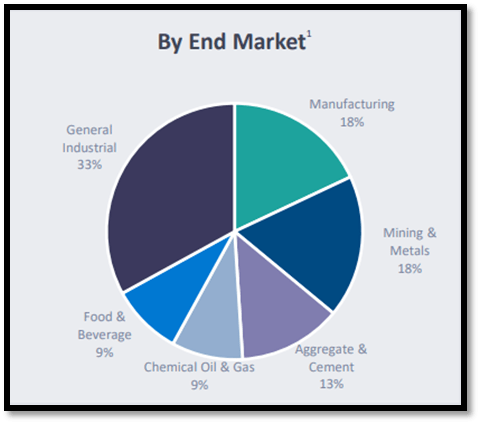
Overall, for the quarter, the strength and performance of RBC’s industrial end markets vary, with some being stronger than others. Aftermarket sales contribute more to overall industrial demand than OEM sales.
During its most recent quarter, RBC reported that the power generation, waste, and water management industries were strong. However, the weakness in the multi-industry aggregate, cement, and oil and gas industries negated the strength of those other industries. Therefore, the overall picture for its industrial segment is mixed. On a brighter note, due to this diversification of end markets, it makes RBC much more resilient as it reduces RBC’s exposure when any particular market faces a decline.
The weakness in the aggregate and cement markets is due to the weakness in the housing industry. Aggregate and cement have correlations with housing starts. Looking at the following US housing starts chart, it is showing signs of decline after February 2024. For context, the mortgage rate has a significant influence on housing starts. Currently, the US 30-year mortgage rate is approximately 6.86%, according to FRED. Looking ahead, the high mortgage rate will continue to exert pressure on the housing market, leading to weakness in the aggregate and cement sectors.
Trading Economics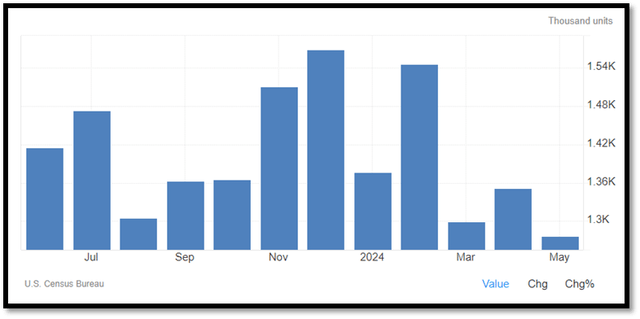
Relative Valuation Model
Author’s Relative Valuation Model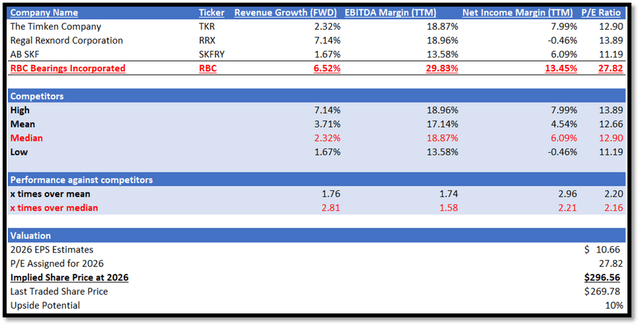
For context, RBC operates in the industrial machinery, supplies, and components industry. In its most recent 10K report, RBC did provide us a list of principal competitors, which I have listed down in my relative valuation model. I will be comparing RBC against its peer group in terms of growth outlook and profitability margins.
For growth outlook, I will be comparing their forward revenue growth rate, as it is considered to be a forward-looking metric. For profitability margins, I will be comparing using EBITDA margin TTM and net income margin TTM, as these two metrics give us a good gauge of their core business activities strength and performance.
In terms of growth outlook, RBC significantly outperformed its peers. RBC has a forward revenue growth rate of 6.52% vs. its peers’ median of 2.32%. This implies that RBC’s forward revenue growth rate is 2.81x over its peers’ median.
Regarding profitability margins, RBC outperformed its peers in both EBITDA margin TTM and net income margin TTM. In terms of EBITDA margin TTM, RBC reported 29.83%, which is higher than its peers’ median of 18.87%. This represents 1.58x over its peers’ median. In terms of net income margin TTM, RBC’s 13.45% is also higher than its peers’ median of 6.09%. RBC’s net income margin TTM is 2.21x over its peers’ median.
Currently, RBC’s forward non-GAAP P/E ratio is 27.82x, which is higher than peers’ median of 12.90x. Given RBC’s significant outperformance in both growth outlook and profitability margins, it is fair for RBC to be trading at a higher P/E. For context, RBC’s 5-year average P/E is 35.80x, and its current P/E is sitting below it.
Looking ahead to 2025, the outlook for RBC is positive based on my forward-looking analysis, and management also shares the same sentiment. For 1Q25, RBC forecasts net sales to be in the range of $415 million and $420 million. Based on 1Q24’s net sales of $387.1 million, this implies a year-over-year growth rate of 7.2% to 8.5%.
For 2025, the market revenue estimate for RBC is approximately $1.67 billion, while EPS is $9.70. For 2026, the revenue estimate is $1.78 billion, and EPS is $10.66. Based on management’s positive outlook, guidance and my forward-looking analysis as discussed, they support the market’s estimate. Therefore, by applying my 2026 target P/E to RBC’s 2026 EPS estimate, my 2026 target share price is $296.56.
Risk and Conclusion
The risk associated with RBC is with regard to its customer composition. According to statistics provided by RBC, in FY2024, FY2023, and FY2022, RBC’s top ten clients accounted for approximately 44%, 41%, and 36% of its net sales, respectively. RBC’s top 10 customer concentration has been gradually increasing, and it is almost nearing half of its net sales in FY2024.
Therefore, in the event that RBC loses one or more of these customers or if this group of customers decreases their spending with RBC, it will have a significant impact on RBC’s financial performance. In addition, manufacturer consolidation will also reduce customer counts. According to the US Department of Defence [DOD], it has been reported that there has been a sharp decline in the number of businesses within the defence industrial base in recent years. In this situation, it might also put pressure on pricing, which will have an impact on RBC’s top and bottom lines.
Although RBC’s past financial results have shown strong net sales growth, FY2024 year-over-year growth has decelerated due to its flat industrial segment. Currently, commercial aerospace’s outlook is positive. In addition, airliner orders are reporting record numbers. They were mainly driven by rising travel demand. On the flip side, RBC’s industrial segment performance is mixed due to some markets performing well and some declining. Given its mixed outlook and a lack of margin of safety in its share price, I am recommending a hold rating for RBC.
Read the full article here
")

")
")
")
")
