


 Headline of the Month February 2025 voting for Sports")

REIT Performance
After a weak start to the year in January (-1.29%), real estate investment trusts, or REITs, moved back into the black with a solid +1.77% total return in February. REITs handily outpaced the broader market as the NASDAQ (-3.9%), Dow Jones Industrial Average (-1.4%) and S&P 500 (-1.3%) all fell into the red in February. The market cap weighted Vanguard Real Estate ETF (VNQ) outperformed the average REIT in February (+3.70% vs. +1.77%) and has significantly outperformed year-to-date (+5.41% vs. +0.79%). The spread between the 2025 FFO multiples of large cap REITs (18.3x) and small cap REITs (13.3x) widened again in February as multiples expanded 1.0 turn for large caps and 0.7 turns for small caps. Investors currently need to pay an average of 37.6% more for each dollar of FFO from large cap REITs relative to small cap REITs. In this monthly publication, I will provide REIT data on numerous metrics to help readers identify which property types and individual securities currently offer the best opportunities to achieve their investment goals.
Source: Graph by Simon Bowler of 2nd Market Capital, Data compiled from S&P Global Market Intelligence LLC. See important notes and disclosures at the end of this article
Micro cap REITs (-1.55%) continued to underperform their larger peers in February. Large caps (+4.58%) led the REIT sector as small caps (+2.00%) and mid caps (+0.98%) also saw February gains. After the first 2 months of 2025, large cap REITs have outperformed small caps by 380 basis points.
Source: Graph by Simon Bowler of 2nd Market Capital, Data compiled from S&P Global Market Intelligence LLC. See important notes and disclosures at the end of this article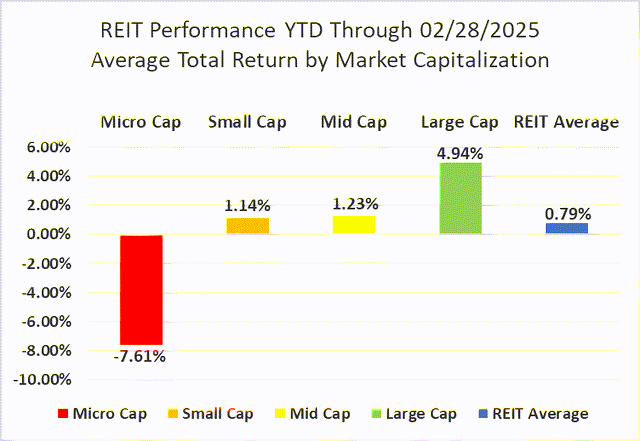
12 out of 18 Property Types Yielded Positive Total Returns in February
66.67% of REIT property types averaged a positive total return in February. There was a relatively narrow 11.64% total return spread between the best and worst performing property types. Land (+7.19%) and Multifamily (+7.16%) outpaced all other REIT property types in February. Data Center (-4.45%) and Hotel REITs (-3.44%) underperformed.
Source: Table by Simon Bowler of 2nd Market Capital, Data compiled from S&P Global Market Intelligence LLC. See important notes and disclosures at the end of this article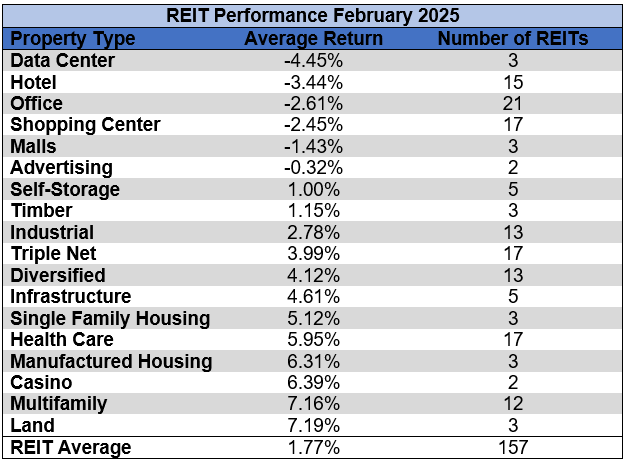
Data Centers (-8.92%) and Office (-6.54%) were the REIT property types that averaged the lowest total return over the first 2 months of 2025. Health Care (+9.18%) and Timber (+8.90%) are the top performers in the REIT sector year to date.
Source: Table by Simon Bowler of 2nd Market Capital, Data compiled from S&P Global Market Intelligence LLC. See important notes and disclosures at the end of this article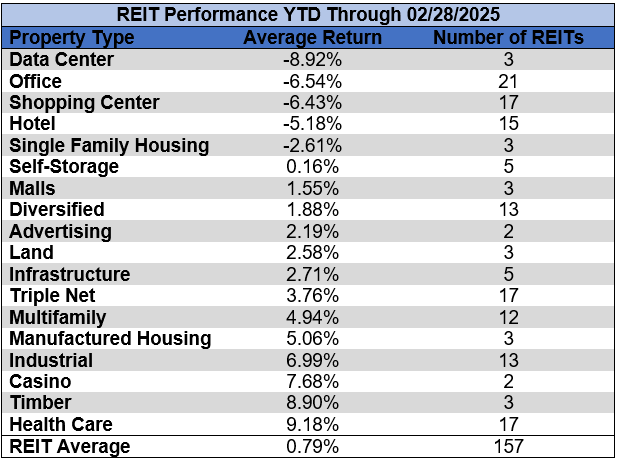
The REIT sector as a whole saw the average P/FFO (2025Y) increase 0.7 turns in February from 13.6x up to 14.3x. 61.1% of property types averaged multiple expansion, 33.3% averaged multiple contraction and 5.6% saw multiples hold steady in February. Land (30.2x), Data Centers (27.6x), Multifamily (21x), Manufactured Housing (20x) and Single Family Housing (18.9x) currently trade at the highest average multiples among REIT property types. Hotels (6.9x) and Office (9x) are the only property types that average single digit FFO multiples.
Source: Table by Simon Bowler of 2nd Market Capital, Data compiled from S&P Global Market Intelligence LLC. See important notes and disclosures at the end of this article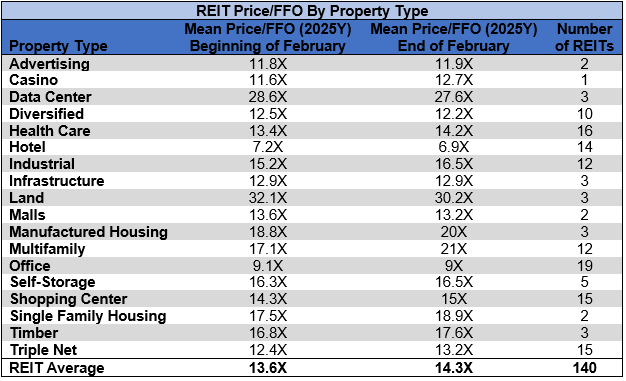
Performance of Individual Securities
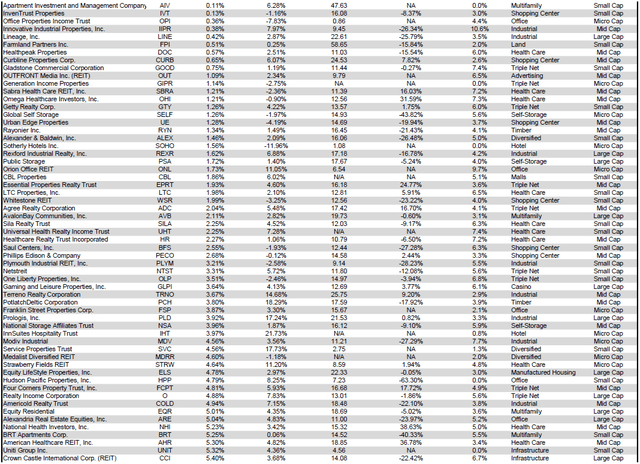
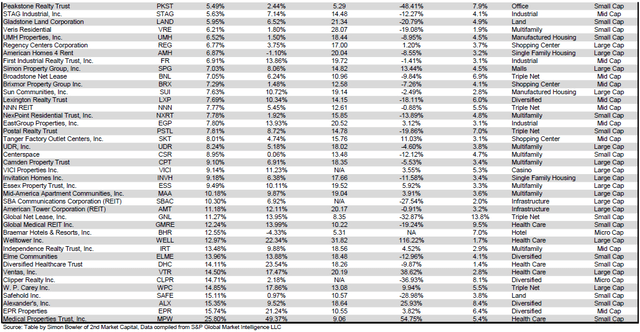
Retail Opportunity Investments Corp. (ROIC) was acquired by Blackstone Real Estate Partners X on February 12th in an all-cash transaction. The retail REIT was purchased at a price of $17.50/share and is no longer publicly traded.
Medical Properties Trust (MPW) (+25.80%) was the best performing equity REIT again in February after leading the sector in January as well with +18.73% total return. Year to date this brings MPW to a remarkable +49.37% return after the first two months of 2025.
Wheeler REIT (WHLR) (-58.31%) saw its multi-year collapse continue in February as it underperformed all other REITs. Combined with a dismal January performance, Wheeler has already plummeted to a disastrous -80.56% YTD total return after just the first two months of 2025.
64.97% of REITs had a positive total return in February. REITs averaged a +1.77% total return in February 2025 outpacing the sector’s performance in February 2024 (-0.81%).
For the convenience of reading this table in a larger font, the table below is available as a PDF as well.
Source: Table by Simon Bowler of 2nd Market Capital, Data compiled from S&P Global Market Intelligence LLC. See important notes and disclosures at the end of this article Source: Table by Simon Bowler of 2nd Market Capital, Data compiled from S&P Global Market Intelligence LLC. See important notes and disclosures at the end of this article Source: Table by Simon Bowler of 2nd Market Capital, Data compiled from S&P Global Market Intelligence LLC. See important notes and disclosures at the end of this article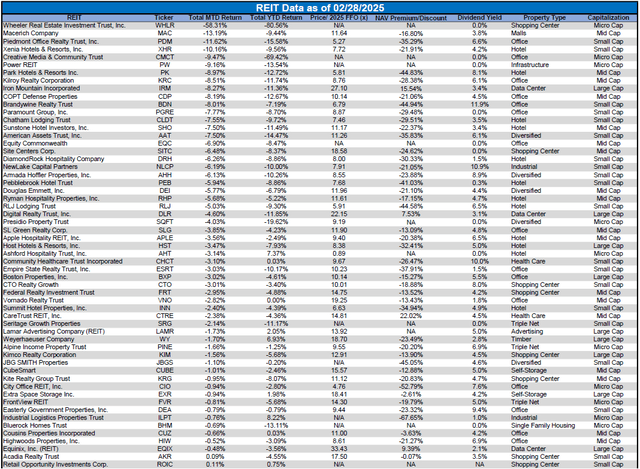
Dividend Yield
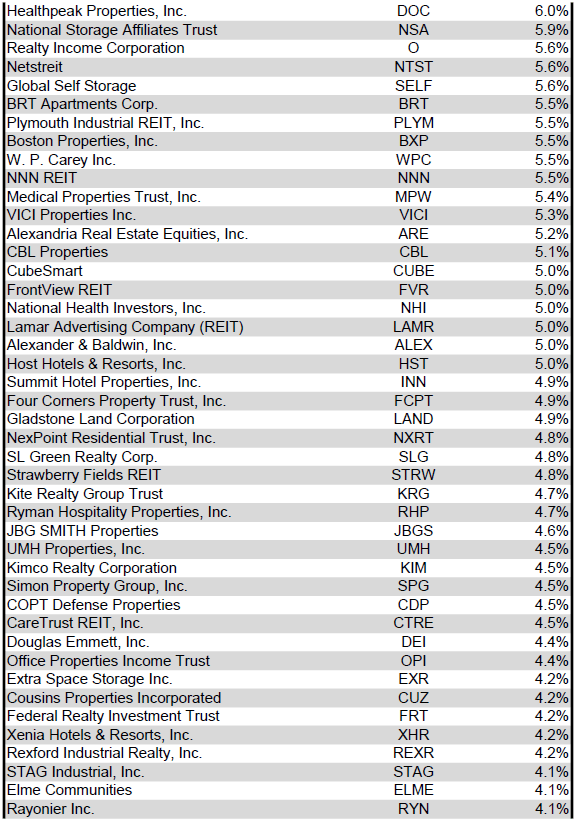
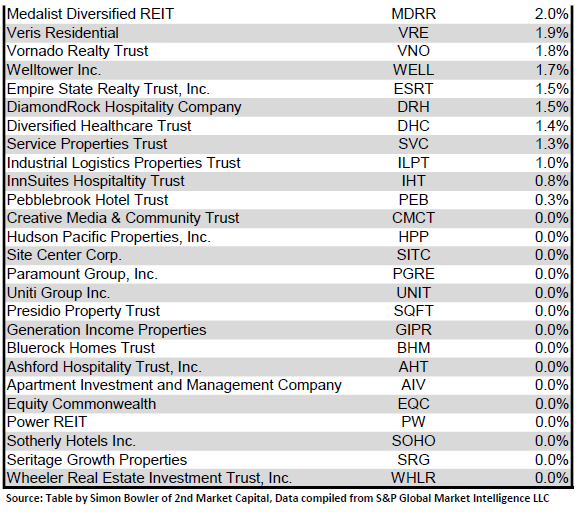
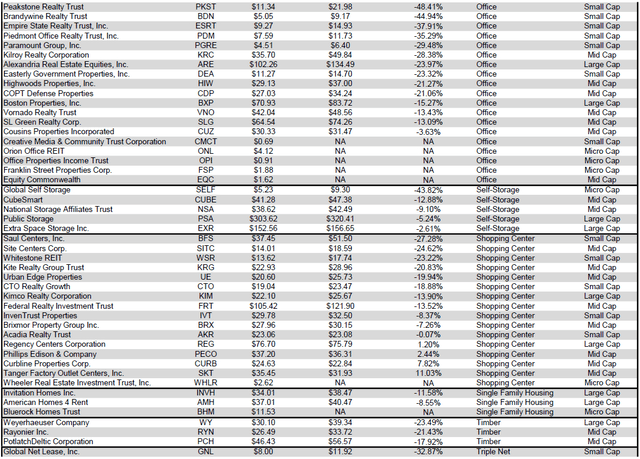
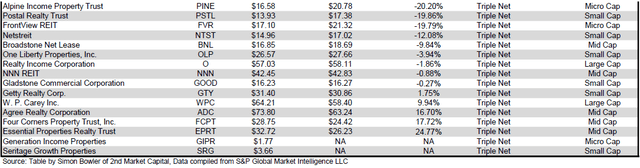
Dividend yield is an important component of a REIT’s total return. The particularly high dividend yields of the REIT sector are, for many investors, the primary reason for investment in this sector. As many REITs are currently trading at share prices well below their NAV, yields are currently quite high for many REITs within the sector. Although a particularly high yield for a REIT may sometimes reflect a disproportionately high risk, there exist opportunities in some cases to capitalize on dividend yields that are sufficiently attractive to justify the underlying risks of the investment. I have included below a table ranking equity REITs from highest dividend yield (as of 2/28/2025) to lowest dividend yield.
For the convenience of reading this table in a larger font, the table below is available as a PDF as well.
Source: Table by Simon Bowler of 2nd Market Capital, Data compiled from S&P Global Market Intelligence LLC. See important notes and disclosures at the end of this article Source: Table by Simon Bowler of 2nd Market Capital, Data compiled from S&P Global Market Intelligence LLC. See important notes and disclosures at the end of this article Source: Table by Simon Bowler of 2nd Market Capital, Data compiled from S&P Global Market Intelligence LLC. See important notes and disclosures at the end of this article Source: Table by Simon Bowler of 2nd Market Capital, Data compiled from S&P Global Market Intelligence LLC. See important notes and disclosures at the end of this article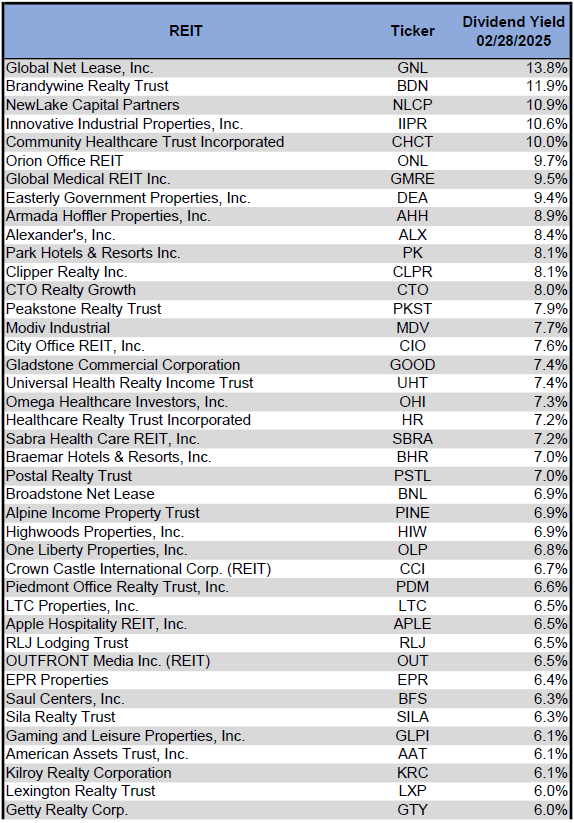

Although a REIT’s decision regarding whether to pay a quarterly dividend or a monthly dividend does not reflect on the quality of the company’s fundamentals or operations, a monthly dividend allows for smoother cash flow to the investor. Below is a list of equity REITs that pay monthly dividends ranked from highest yield to lowest yield.
Source: Table by Simon Bowler of 2nd Market Capital, Data compiled from S&P Global Market Intelligence LLC. See important notes and disclosures at the end of this article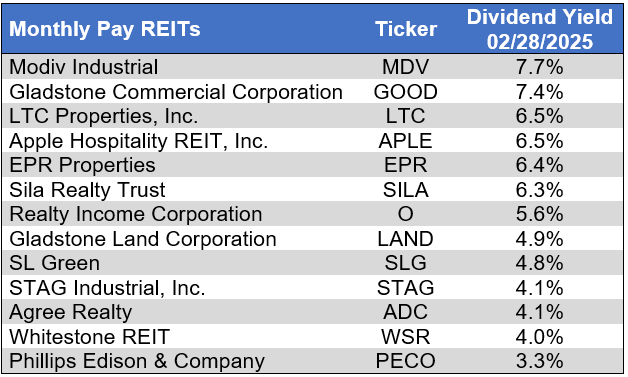
Dividend News
26 REITs announced dividend raises in February, 24 of which pay quarterly dividends and 2 of which pay monthly. DiamondRock Hospitality (DRH) (+166.7%) announced the largest dividend hike followed by First Industrial Realty Trust (FR) (+20.3%) and Xenia Hotels & Resorts (XHR) (+16.7%).
S&P Global Market Intelligence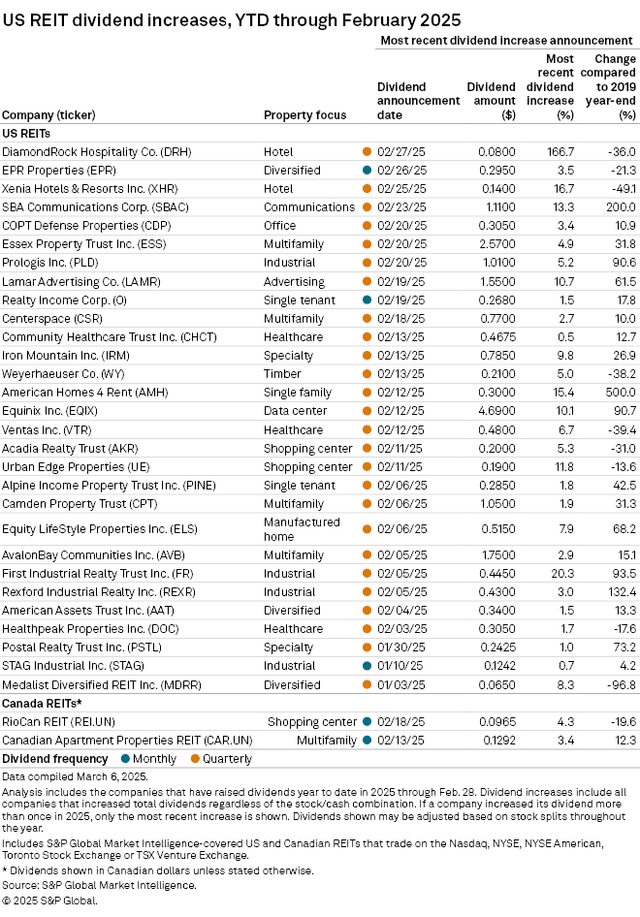
Economic Health
February 2025 saw the number of corporate bankruptcy filings decline month-over-month to the lowest level since September. However, bankruptcy filings during the first two months of 2025 were 57% higher than during the first two months of 2024. The number of bankruptcy filings year-to-date was the most in the first two months of any year since 2010.
S&P Global Market Intelligence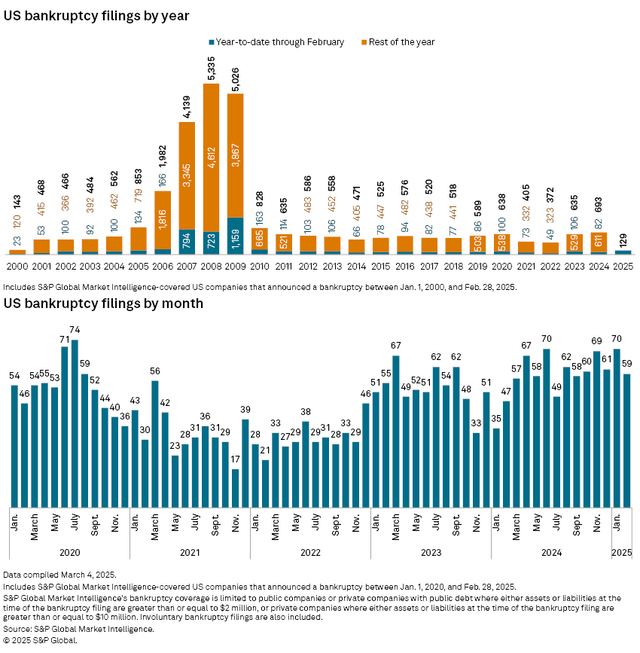
The multifamily delinquency ratio at US banks increased for the 6th straight month, rising to 1.35% in Q4 2024 from 0.55% the year prior. This is the highest level since Q2 2013 when the ratio was 1.53%. While these delinquencies do not reflect financial conditions among multifamily REITs, which primarily own assets of higher quality than the average multifamily property, it does reflect a sharp rise in distress within the multifamily sector as a whole.
S&P Global Market Intelligence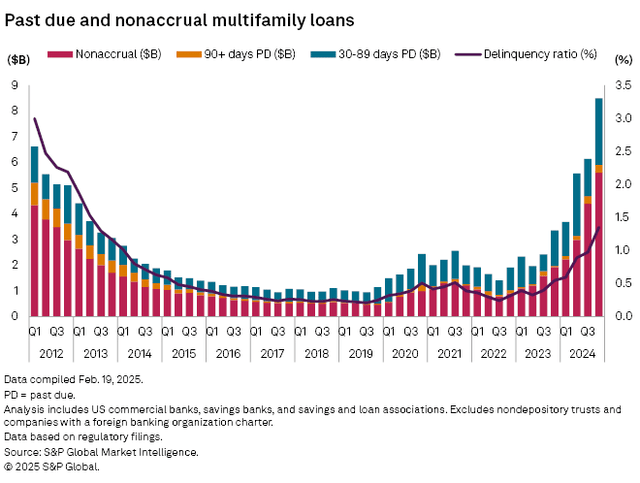
Valuation
REIT Premium/Discount to NAV by Property Type
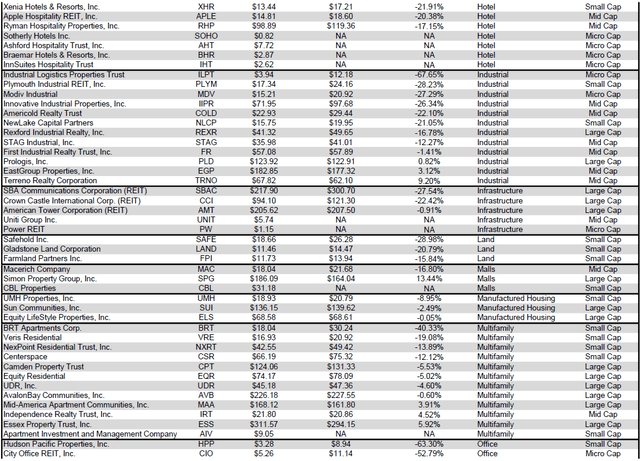
Below is a downloadable data table, which ranks REITs within each property type from the largest discount to the largest premium to NAV. The consensus NAV used for this table is the average of analyst NAV estimates for each REIT. Both the NAV and the share price will change over time, so I will continue to include this table in upcoming issues of The State of REITs with updated consensus NAV estimates for each REIT for which such an estimate is available.
For the convenience of reading this table in a larger font, the table below is available as a PDF as well.
Source: Table by Simon Bowler of 2nd Market Capital, Data compiled from S&P Global Market Intelligence LLC. See important notes and disclosures at the end of this article Source: Table by Simon Bowler of 2nd Market Capital, Data compiled from S&P Global Market Intelligence LLC. See important notes and disclosures at the end of this article Source: Table by Simon Bowler of 2nd Market Capital, Data compiled from S&P Global Market Intelligence LLC. See important notes and disclosures at the end of this article Source: Table by Simon Bowler of 2nd Market Capital, Data compiled from S&P Global Market Intelligence LLC. See important notes and disclosures at the end of this article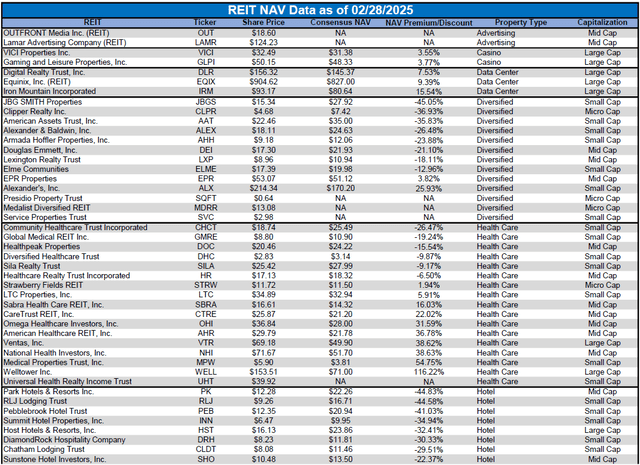
Takeaway
The large cap REIT premium (relative to small cap REITs) widened slightly in February and investors are now paying on average about 38% more for each dollar of 2025 FFO/share to buy large cap REITs than small cap REITs (18.3x/13.3x – 1 = 37.6%). As can be seen in the table below, there is presently a strong positive correlation between market cap and FFO multiple.
Source: Table by Simon Bowler of 2nd Market Capital, Data compiled from S&P Global Market Intelligence LLC. See important notes and disclosures at the end of this article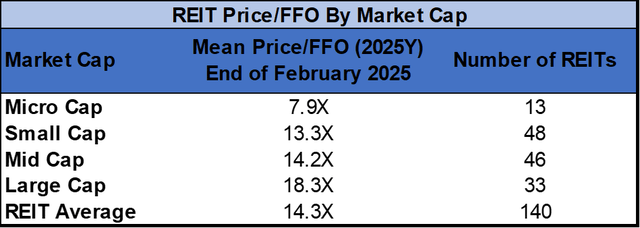
The table below shows the average NAV premium/discount of REITs of each market cap bucket. This data, much like the data for price/FFO, shows a strong, positive correlation between market cap and Price/NAV. The average large cap REIT (-0.61%) trades in line with NAV. Mid cap REITs (-5.73%) trade at a mid-single-digit discount to NAV. Small cap REITs (-20.91%) trade at just under over 4/5 of NAV while micro caps (-33.32%) trade at about 2/3 of their respective NAVs.
Source: Table by Simon Bowler of 2nd Market Capital, Data compiled from S&P Global Market Intelligence LLC. See important notes and disclosures at the end of this article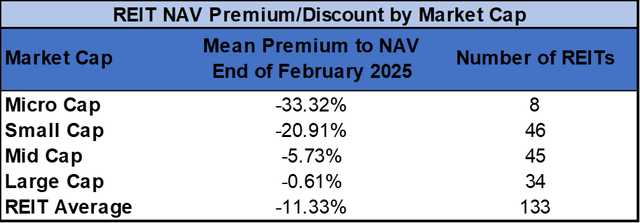
Significant Disparities in Valuation Exist Within the REIT Sector
REIT price to net asset value (P/NAV) currently varies widely across the sector, ranging from a -67.7% discount to a +116.2% premium. Office and Hotel REITs accounted for 6 of the 10 most discounted equity REITs as of the end of February. The REITs that currently trade at the widest discounts to NAV are Industrial Logistics Properties Trust (ILPT) (-67.7%), Hudson Pacific Properties (HPP) (-58.5%) and City Office REIT (CIO) (-52.8%).
S&P Global Market Intelligence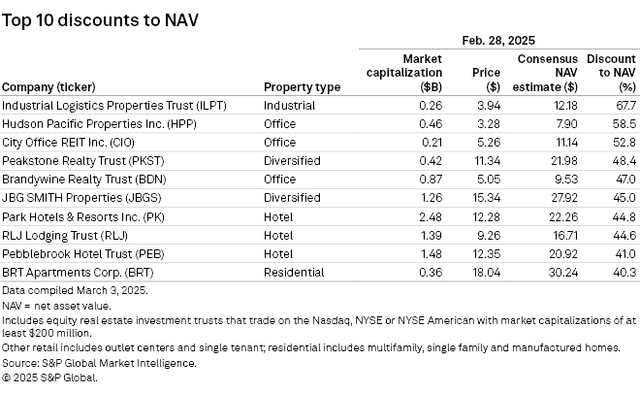
Healthcare REITs account for 7 of the 10 REITs trading at the largest premiums to NAV. The REITs with the largest NAV premiums as of the end of February are Welltower (WELL) (+116.2%), Medical Properties Trust (MPW) (+55.4%) and National Health Investors (NHI) (+39.8%).
S&P Global Market Intelligence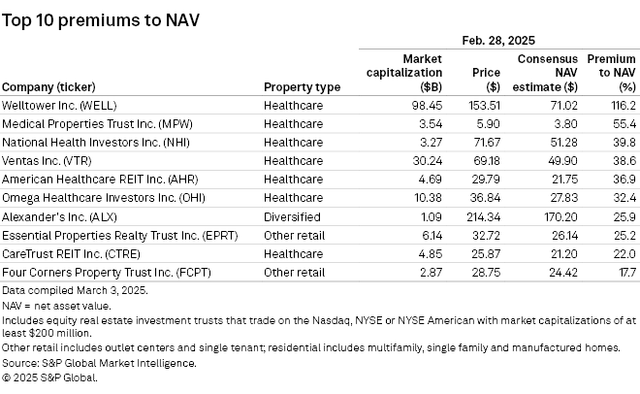
It is important to note that while analyst consensus NAVs are a valuable tool for assessing whether a particular security is attractively priced vs. overpriced, they can sometimes lag behind when a REIT experiences a significant change that impacts valuation. This lag is due to analysts updating their NAV estimates for each REIT periodically rather than in real time.
S&P Global Market Intelligence
For example, in recent months Medical Properties Trust (MPW) has had a flurry of major positive updates (most notably pertaining to debt and tenants) that fueled the pure-play hospital REIT to be the top performing equity REIT in both January and February. However, MPW’s consensus NAV still includes analyst NAV estimates (shown in the table above) that have not yet been updated since key company updates were announced. Of the 8 analyst NAV estimates, only half have been updated in March, all four of which were upward revisions. Share prices always adjust much faster than analysts’ NAV estimates do, so when comparing a REIT’s current share price to the consensus NAV, it is important to be aware that recent news or data (such as quarterly earnings or other releases by the company) may not be fully reflected in the consensus NAV.
Editor’s Note: This article covers one or more microcap stocks. Please be aware of the risks associated with these stocks.
Read the full article here

")

 Q4 2024 Earnings Call Transcript")
")

")