


")
Introduction
Even in a bull market, picking the right stocks can make a (big) difference.
Automakers belong to an industry that has seen investors fleeing due to several concerns. As electric vehicles are developed and sold, there is an intensive need for capital to fund this technological turnaround. Nowadays, capital intensity is not the most desired business quality by investors. In addition, the industry is highly competitive and this leads to low margins. Finally, it is highly exposed to interest rate fluctuations.
I am no fan of the industry. However, I am exposed to a few names because I came to understand I was before some true deals that had many resemblances with Peter Lynch’s investment in Ford back in the late 80s.
As we can see from the 3-year graph below, two automakers have been able to beat the S&P 500. Spoiler alert: Tesla is not among these two. The index returned 31.4%, while Toyota (TM) returned almost 64% and Stellantis (STLA) almost 66%, not counting dividends.
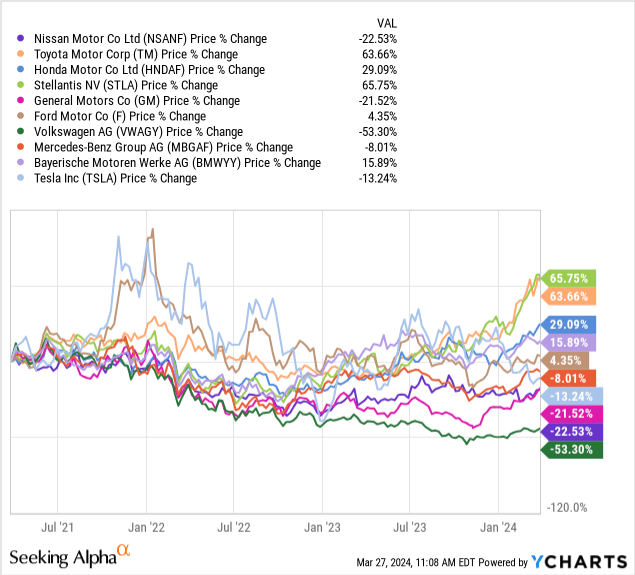
My strategy has been to pick the most profitable names in the industry, which were managing their balance sheets conservatively while gradually funding the capex needed for the new electric cars. This is why I made Stellantis a cornerstone of my portfolio considering its depressed valuation was unjustifiable given its strong fundamentals.
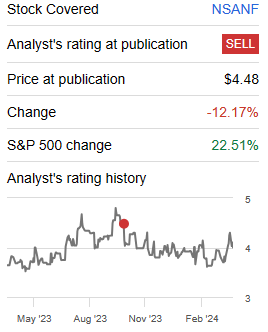
While I have warned a few times that bad times for Tesla were likely, I have also taken a bearish stance on a player some analysts were bullish on: Nissan (OTCPK:NSANF, OTCPK:NSANY). More in detail, back in September, more than one commentator thought that the UAW strike would benefit Japanese automakers, and Nissan among them.
As far as we are concerned, rating Nissan as a sell back in October turned out to be a correct valuation. Please, remember I was by no means suggesting to short the stock, but rather, to lock in any gains and protect them from future downturns.
Seeking Alpha
Nissan recently reported its Q3 results. Let’s take a look and see if there is any substantial change that can lead to a rating revision.
Nissan’s Q3 Financials
Nissan reports in the official currency of Japan, the Yen (¥). Currently, ¥1 is worth $0.0066. To make things easier for SA readers, I will report Nissan’s financials in U.S. dollars.
Nissan reported 22% net revenue growth, 65% operating profit, and 183% net income growth YoY. This translates into a quarterly revenue of $22 billion, a gross profit of $3.58 billion, and a net income of $207 million. As a result, the company announced during its Q3 earnings call that it has enhanced its shareholder return by restoring an interim dividend and buying back shares.
Nissan volumes, however, have been rather flat, with only 1.2% growth to 2.4 million units. Why is this? Because China is performing poorly.
Excluding this market, Nissan reports a 20.4% retail sales growth, the same that the company reported two quarters ago. Back then North America was up 33.1%. Now it is up 29.7%. This shows how the UAW strike was probably not long enough to shift a consistent share of sales from the Detroit Big Three to their Japanese competitors. In fact, North America for Nissan seems to be decelerating, while Europe seems to be picking up speed once again.
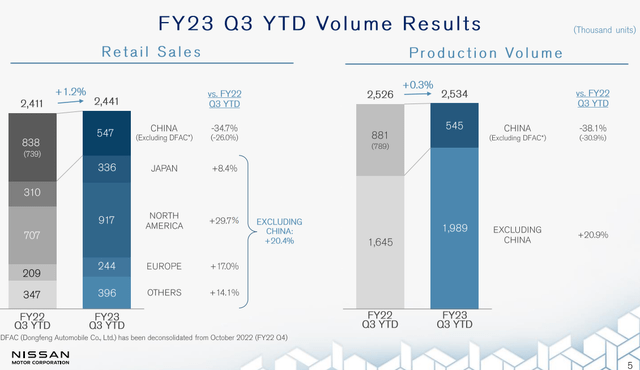
Nissan Q3 2023 Results Presentation
Automakers, no matter how we view them, are top-line-driven businesses. Volumes are extremely important because of the high fixed costs that need to be absorbed.
In any case, Nissan keeps having some headaches in China, which is no marginal issue for a company whose sales in that market made up over 30% of total sales. But, outside of that market, Nissan’s volumes are increasing.
Let’s zoom out and take a look at the overall financial performance. So far, automakers have been enjoying very good and profitable years. Most of them have flexed once again their pricing power as demand for new vehicles increased while supply was low. This has created many interesting recoveries, in terms of the margins.
Nissan’s operating margin went up YoY by 130 bps from 3.9% to 5.2%. And the company’s free cash flow has gone up from around $139 million to over $1.2 billion YoY. This is a great improvement. But such rebounds also show the hick-ups the company had last year in terms of operations and working capital management.
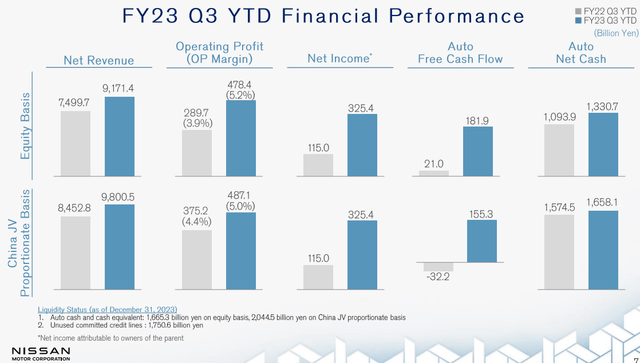
Nissan’s Q3 Results Presentation
Back to OP margins. Though I consider Nissan’s improvement good, I frankly don’t understand why we should invest in this stock, given that it trades at higher multiples compared to much more profitable peers. But we will get to this in a moment.
Nissan’s FY outlook can be now considered accurate since there is only one quarter left to close its fiscal year. Compared to what the company forecasted at the end of its first fiscal quarter, we have a downward revision of its main targets.
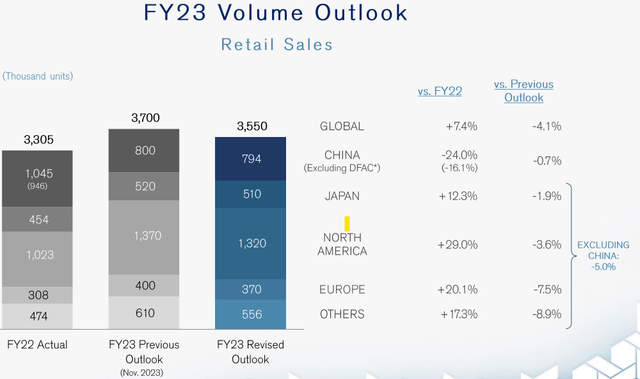
Nissan’s Q3 Results Presentation
Nissan started its fiscal year forecasting 4 million units would be sold. Then it lowered it to 3.7 million. Now it has targeted 3.5 million units. Excluding China, Nissan was expecting a 1% YoY growth in sales. Now it is expecting a 5% decrease.
Of course, we have seen that revenues and profits are increasing. But China’s decline should not be overlooked. It means production plants there are not being used as much as forecasted. The company is using these plants to produce for other regions, but this leads to increasing shipping costs which inevitably eats away at Nissan’s margins.
As a result, during the Q3 earnings call Nissan’s management had to answer a few questions about this situation:
Turning to China, the competition continues to be intense. It’s a 26% fall in nine-month retail sales at 547,000 units. […] The market situation in China is very intense. The price war, to be honest, is a bit crazy. And we made sure we were disciplined and making sure that we were not just blindly following in the first three quarters. […] The battle for the car sales in China continues. We still see continued escalation in some of the office buys, especially the newcomers. And they keep trying to buy and gain market share by spending a lot of money. But for Nissan, of course, we want to stay relatively competitive. So we will make sure we enhance appropriately, but not too much. But make sure that we are targeting the right audience.
Were Nissan a niche brand such as Porsche or even Ferrari, I would not be as concerned. However since Nissan is not a luxury manufacturer (its luxury brand is Infiniti), it is more exposed to competition and pricing wars. In this situation, a company can either fight back by improving its efficiency or by having a unique product. In Nissan’s case, I see both strategies as difficult to pursue. The company will have to deal with its plant investments in China and see if it can once again gain market share there or if these plants need to produce for other end-markets. This is in any case costly. Unique products in automotive don’t last long because of technological changes and fashion changes. Only top-end brands such as Ferrari or Lamborghini can conceive themselves as truly offering a unique vehicle.
Some signs of efficiency sloppiness were spotted by an analyst during the last earnings call, when he asked the company to elaborate on automotive free cash flow, seeing that inventories are rising and, therefore Q3 FCF is turning negative.
The answer Nissan’s management gave was the following,
We had faced in Q3 much more aggressive action by our competitors. And I think you know which one I am referring to, but they had gone very quickly and we had to adjust within the quarter several times our incentive strategy, just to make sure we remained competitive.
Here Nissan was not only talking about Chinese competitors, but about Tesla aggressively slashing its prices. Nissan is trying to play a role in the EV market. In Japan, 53% of its sales are electrified models, and in Europe, Nissan reached 48% of total sales.
Valuation
On Seeking Alpha, we can create a thorough comparison between Nissan and its major competitors.
Nissan’s PE is a 5, while Toyota (TM) has an 11, Stellantis (STLA) a 4.4, GM a 6.1, Ford (F) a 12.1, and Volkswagen (OTCPK:VWAGY) a 3.7.
So, these companies’ earnings are priced differently. This could be explained by the growth rate. But Nissan’s revenue growth in the past four years is flat, while Toyota has grown almost 8%, Stellantis 21%, GM 3.2%, Volkswagen 6.5%, and even Ford grew by 2%. We have to see whether Nissan will be able to outgrow its competitors going forward.
Moreover, when we look at what happens below the top line, Nissan’s earnings appear to be less valuable than some of its peers. In fact, Nissan’s EBIT margin is 4.6%, beating only Ford’s 3%. Even GM, not exactly the most profitable automaker, does better with 5.6%. But there are picks in the industry that can offer double-digit margins: Toyota reports an 11.1%, while Stellantis does even better with a 12.1%.
These are true earnings that belong to the shareholders. Why would one want to invest $100 to earn $4.60 when there are a couple of opportunities that generate $11 or $12?
One final metric, which is even more important. Nissan’s return on total capital is 2.7%. Toyota is at 5%. Stellantis sports a whopping 13.6%. Over the long term, this is a true driver of returns and can lead the stocks in very different directions.
Nissan’s dividend yield (3.3%) is also lower than Stellantis’ (5.8%) Ford’s (4.6%) or even Volkswagen’s (6.2%) meaning the stock is more expensive than the others. And yet, Nissan’s dividend is less consistent than other dividends. Stellantis, for example, though a rather new company formed only three years ago, has been able to pay consecutive increasing dividends, supported by a very high cash balance and strong industrial free cash flow generation.
This is why I consider Nissan too expensive compared to what it offers. Moreover, I think investors should move out of this stock because the opportunity cost of hanging on to the shares of a mediocre company in terms of financial metrics compared to the best players in the industry is high.
Let me explain this with an example. The opportunity cost of an investment comes from the difference in return between the investment itself and the one that was not chosen. It can be calculated therefore in the following way:
Opportunity cost = return of foregone investment – the return of chosen investment.
In this case, we have an opportunity cost coming from the difference between 13.6% and 2.7%. The outcome is 10.9%. It means investors in Nissan are potentially missing out on a return of $10.90 for every $100 invested. I would not think twice about what to do considering these numbers.
Editor’s Note: This article discusses one or more securities that do not trade on a major U.S. exchange. Please be aware of the risks associated with these stocks.
Read the full article here
")
")

")
 preview")
